for your Commodity Assessment and Quality Control
The Benchmark for Agri-Commodity Inspection
Defining a New Standard in Quality Control
Equipped with pioneering AI and visual analysis software, the SpectraAlyzer GRAIN VISION AI sets a new benchmark for precision and operational efficiency.
With analysis speeds exceeding 1,000 kernels per minute, it outperforms conventional solutions while processing samples up to 500 g in just one cycle.
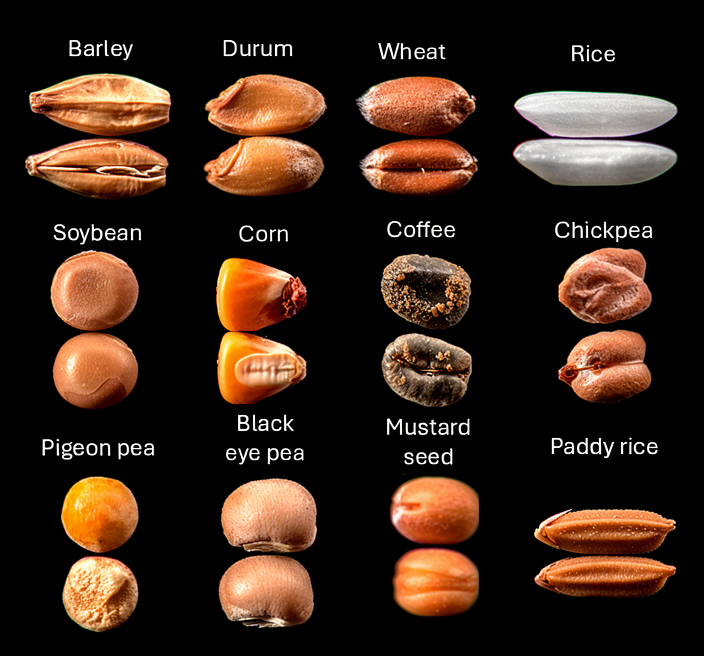
Built for every stage of the grain supply chain.
Built for real-world operations – from breeding and research to harvest, packaging, and trade – the system supports a wide range of grains and seeds, including rice, wheat, barley, quinoa, lentils, and coffee beans. It empowers decision-makers at every stage with accurate, actionable insights.
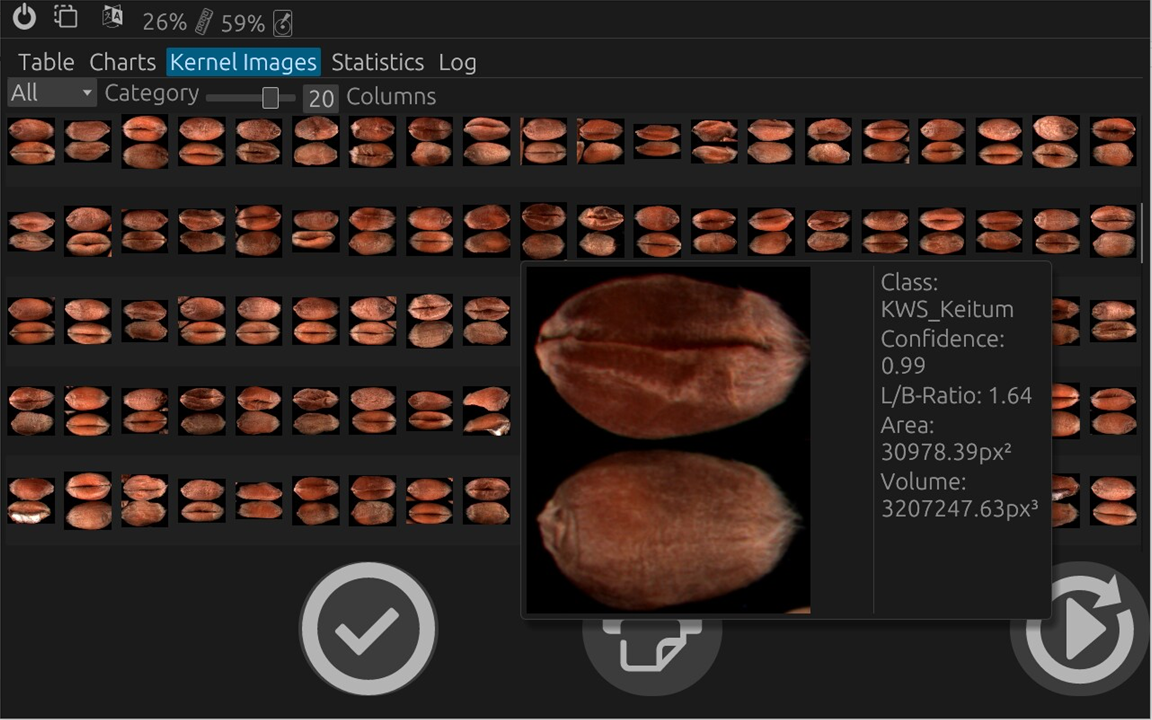
The SpectraAlyzer GRAIN VISION AI supports streamlined workflows. Operators follow standardized sampling, scan with minimal preparation, and receive clear outputs—variety classification, confidence indicators, and quantified percentages—shown in an intuitive interface. Automated reporting creates traceable records for audits, supplier scorecards, and customer claims, while role-based access and time-stamped results help protect data integrity. Because the process is non-destructive, you can retain samples for retention, arbitration, or further lab work.

Superior Performance
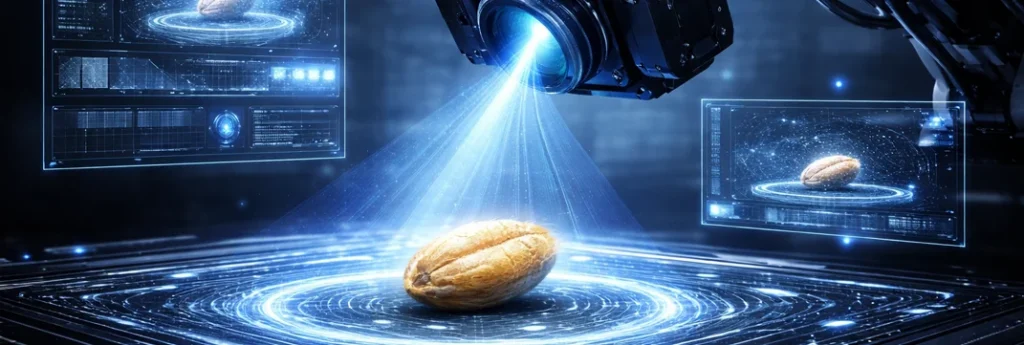
Captured images undergo advanced preprocessing and real-time segmentation.
AI-powered classifiers precisely determine the size, shape, and volume of each kernel, delivering consistent, traceable results.
Multispectral illumination together with 3D Vision enhances the visibility of hidden defects, improving detection accuracy across all material types.


AI-driven Morphology Analysis – Fast, Reliable, Unmatched.
Results You Can See – And Trust

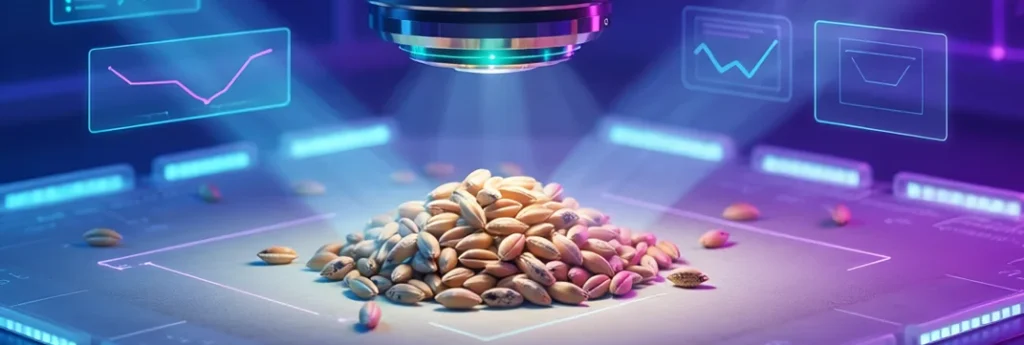
Automated, accurate grain quality evaluation — powered by AI.
Instead of slow, subjective visual inspection, our instrument analyzes high-resolution images to detect, segment, and assess every kernel automatically. It evaluates morphology, color, texture, and structural patterns to reliably classify defects and varietal differences.
Identify broken kernels, insect damage, and grain types with fast, repeatable, objective results—so you can make confident decisions at scale.

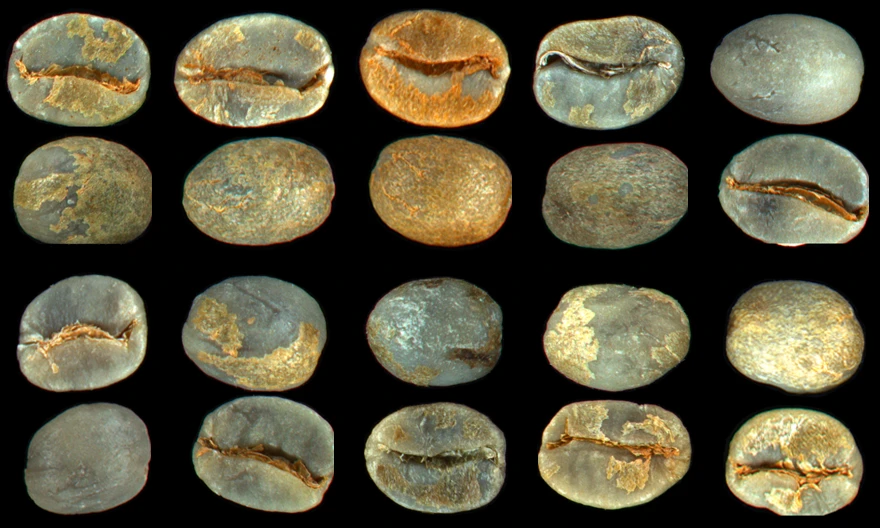
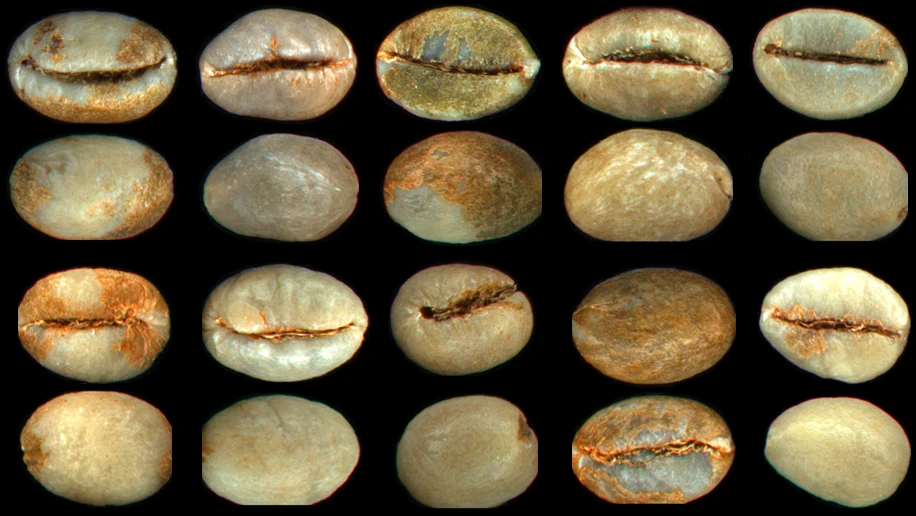
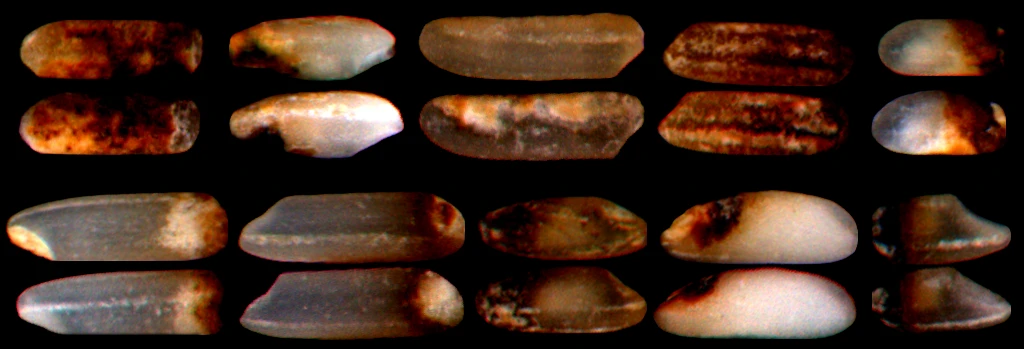
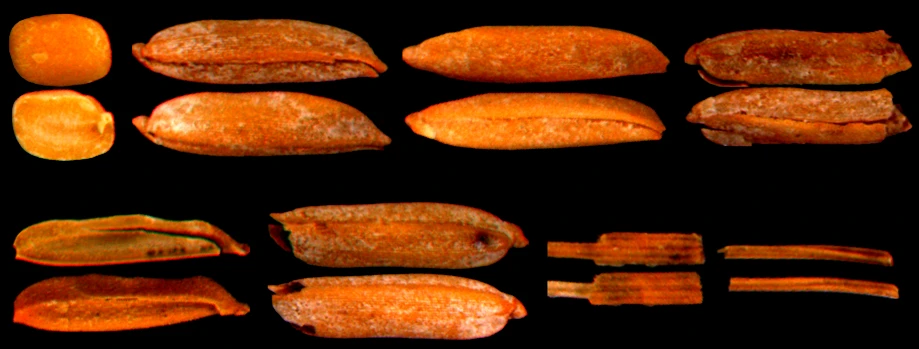
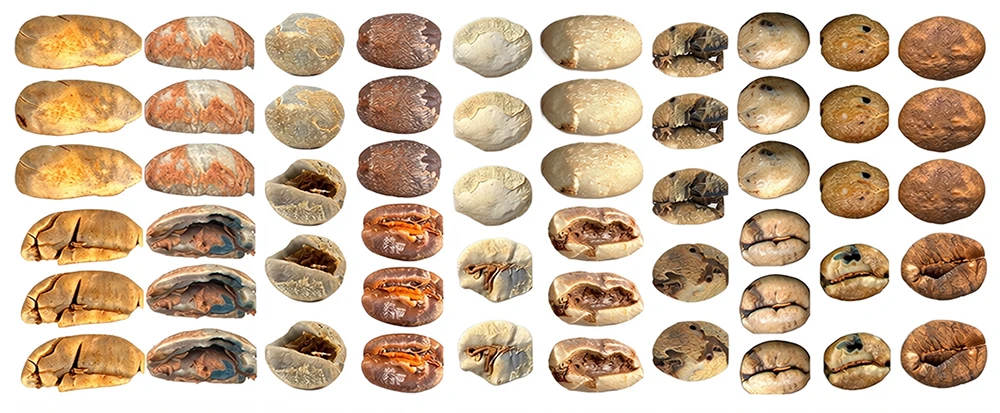
Our 3D Particle Scan captures each kernel from multiple perspectives—using any combination of camera and illumination profiles.
Switch instantly between bottom, top, side, or mixed lighting to reveal transparency, surface texture, and subtle morphology that standard imaging can miss. The result: clearer data for more precise AI-driven classification and defect detection.

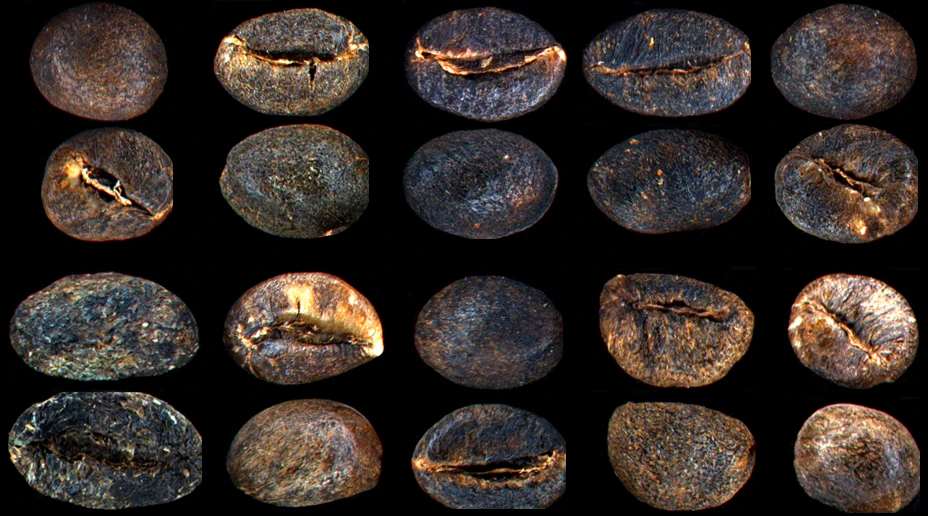
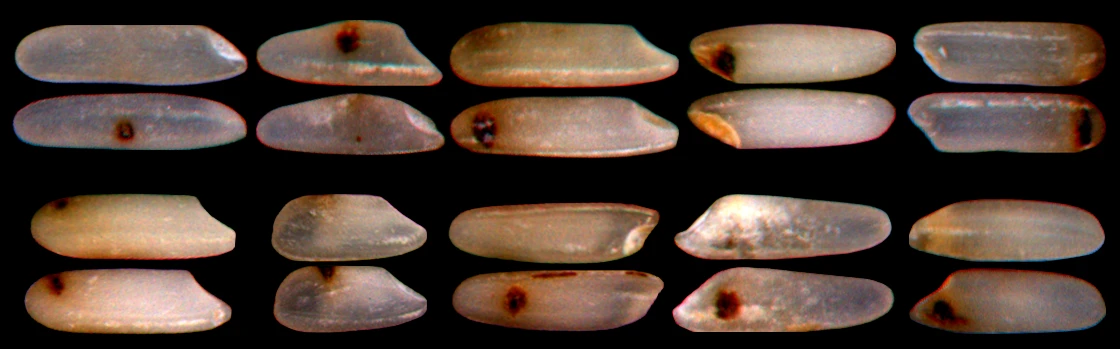
Consistent analysis starts with consistent lighting.
Our multichrome lighting blends multiple wavelengths and automatically tunes the spectrum to boost contrast and reveal fine surface details—making subtle defects easier to see than with standard illumination. The Auto-Balance Lighting engine continuously calibrates brightness, color, and exposure to reduce shadows and glare across batches and environments.
The result: perfectly lit, high-quality images—ideal for precise AI segmentation and reliable classification.
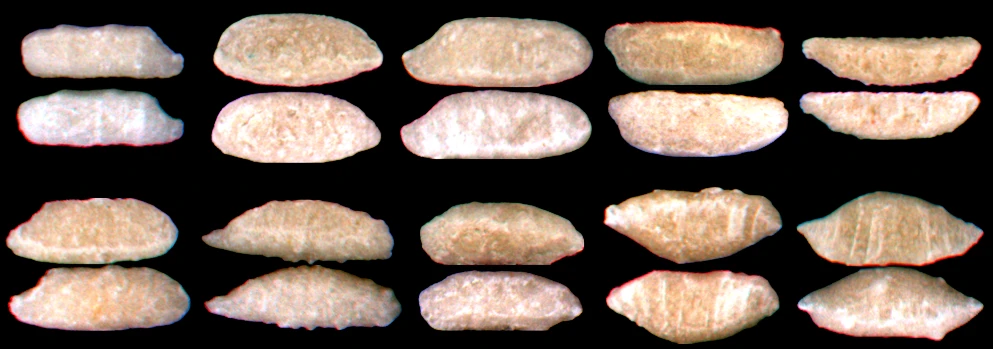
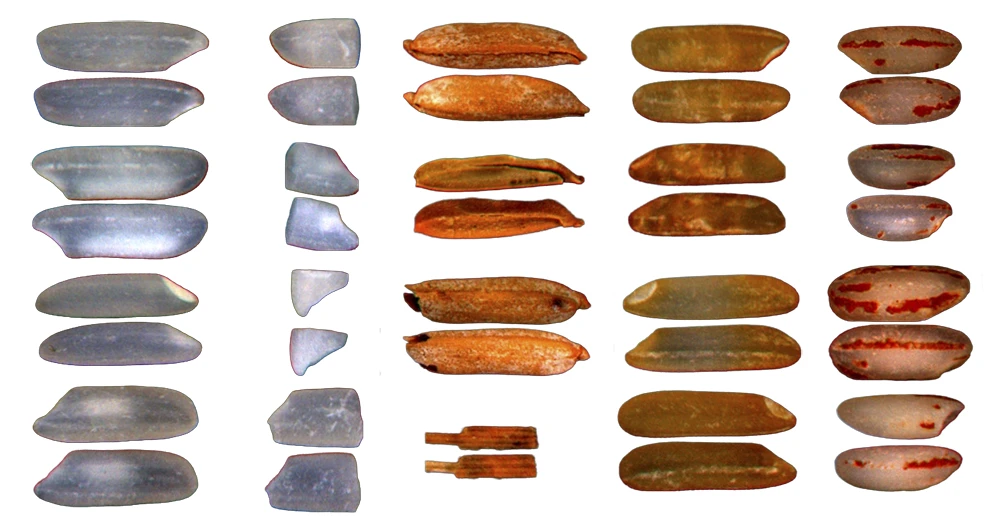
Measure what matters, not what’s assumed.
Explore your agricultural commodity from surface to core
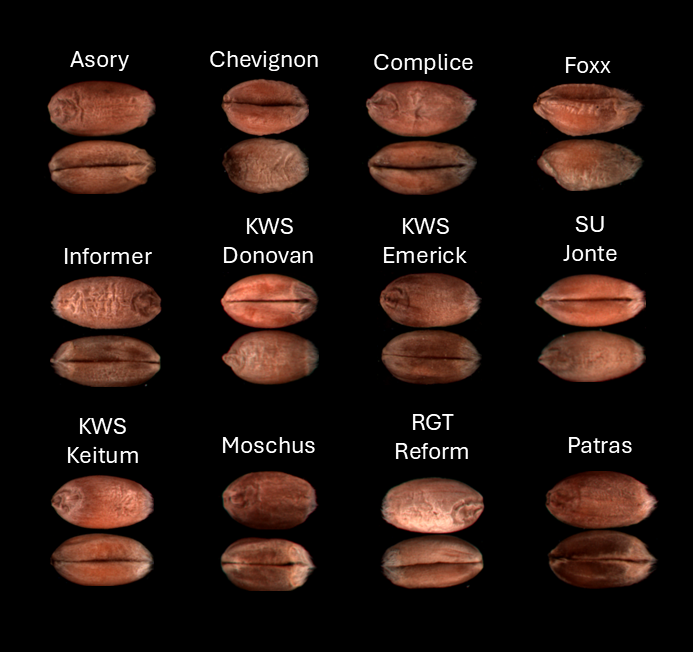
Variety
Variety matters. In grains, oilseeds, pulses, and specialty crops, the declared variety influences price, processing behavior, shelf life, and compliance with contracts and regulations. Yet traditional variety checks often rely on visual sorting, individual expertise, or slow lab methods—leaving room for delays, disputes, and costly surprises.
Spectraalyzer VISION AI brings speed and confidence to variety analysis and determination by combining high-resolution imaging with spectral intelligence. Instead of judging only what the eye can see, the SpectraAlyzer captures rich optical signatures and morphology cues, then applies trained machine-learning models to identify and quantify varieties with consistent, repeatable logic. The result: objective decisions you can stand behind—shipment after shipment.
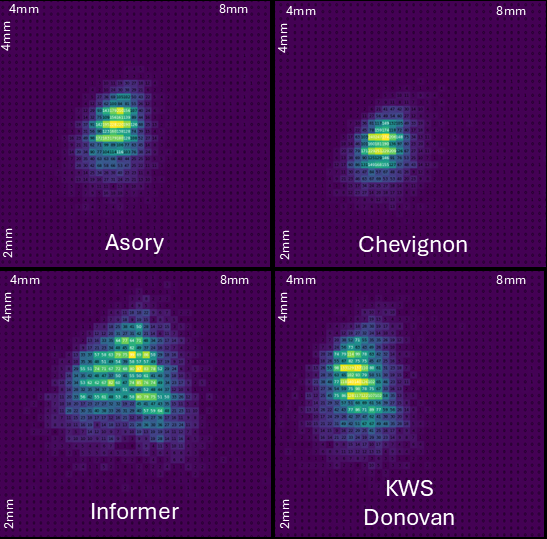
Particle Size distribution (PSD)
From measurement to confidence. The best PSD tool doesn’t just produce numbers—it reduces uncertainty. SpectraAlyzer VISION AI helps teams move from “we think it’s within range” to “we can prove it.” It makes particle size and distribution determination practical enough for routine use and rigorous enough for defensible decisions.
When you can see the full distribution—fines, targets, and oversize—you gain control. You can prevent problems instead of reacting to them, tune processes instead of overcompensating, and align suppliers, sites, and customers around shared standards.
In a market where consistency is rewarded and variability is penalized, PSD insight becomes a competitive advantage. With the SpectraAlyzer VISION AI, particle size and distribution determination becomes faster, more objective, and more actionable—helping you protect quality, optimize performance, and deliver products that meet spec the first time, every time.

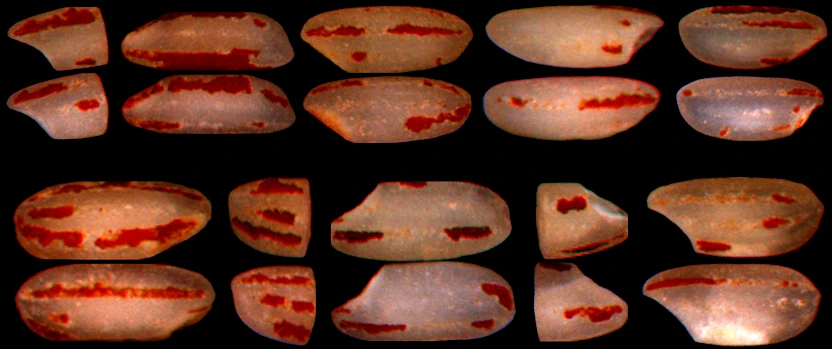
Defect Identification
Product specific Classifications
Barley: smarter routing for malting vs. feed, with consistent grading across sites. Barley value often depends on whether a lot meets malting requirements or must be routed to feed. That routing decision can carry significant financial impact—and it’s frequently driven by attributes that can vary widely within a lot. Also varietes play a dominant role. The SpectraAlyzer VISION AI supports barley-focused classifications designed to strengthen routing decisions and improve consistency.
Durum wheat translucency: objective vitreousness classification at scale: Translucency (often referred to as vitreousness) is a contract-critical attribute in durum wheat. It can influence milling behavior and semolina quality expectations, yet it can be challenging to grade consistently using manual methods—especially across varying environments and time pressure. SpectraAlyzer VISION AI enables durum translucency classification with a more repeatable, defensible approach.
Legumes (pulses) such as peas, lentils, beans, and chickpeas can exhibit a wide range of defects that affect grade, appearance, hydration/cooking performance, and buyer acceptance. Many defects are subtle, and the commercial impact depends on defect type as well as percentage. SpectraAlyzer VISION AI supports legume defect determination and distribution with commodity-relevant classifications.
Two complementary technologies, one decisive workflow
SpectraAlyzer GRAIN VISION focuses on what the eye—and traditional grading—has always tried to capture, but does it at a higher scale and with greater consistency:
-
kernel and seed appearance, shape, and size distribution
-
defects and their distribution (e.g., broken kernels, discoloration, damage patterns, foreign matter)
-
uniformity and mixing indicators that often drive commercial disputes
-
commodity-specific classifications that influence value and processing outcomes
SpectraAlyzer GRAIN NEO focuses on what visual inspection cannot reliably measure: the internal composition and functional characteristics that define performance and compliance, such as:
-
key quality components (commonly including moisture and other compositional parameters depending on product configuration)
-
objective, repeatable results that support blending, process control, and contract verification
Separately, each instrument strengthens decision-making. Together, they create a powerful standard: VISION verifies what’s present physically; NEO verifies what’s present chemically. That combination reduces blind spots, shortens decision cycles, and elevates quality assurance from “inspection” to quality intelligence.
Confidence starts with complete inspection.
Discover our technology
SpectraAlyzer GRAIN VISION AI combines high-resolution imaging with advanced machine learning to classify commodities with consistent, objective precision. It detects defects, uniformity, and key quality traits at scale - delivering fast, traceable results you can trust for confident decisions.
Image Acquisition
Advanced Imaging Technology
SpectraAlyzer GRAIN VISION AI is built around a simple idea: if you want consistent, defensible quality results, you must first capture consistent, defensible images. That’s why the system’s camera technology and physical setup are engineered as a controlled imaging environment—not a “camera pointed at a sample.” Every element of the imaging chain (optics, lighting, geometry, and calibration) is designed to reduce variability and reveal the kernel-level features that matter for grading, defect determination, and distribution analysis.
An imaging system designed for repeatability
In grain inspection, small changes in lighting, angle, distance, or exposure can change how defects appear -especially for subtle traits like mild discoloration, surface damage, chalkiness, or fine foreign material. The SpectraAlyzer GRAIN VISION AI addresses this by combining industrial-grade camera modules with a fixed mechanical geometry and controlled multispectral illumination. The result is a repeatable “measurement scene” where the same sample produces the same visual evidence day after day, across operators and locations.
Why this camera setup translates into better AI results
SpectraAlyzer VISION AI’s AI classifications – defects, foreign material, size distribution, uniformity, and commodity-specific traits – depend on clean segmentation and reliable feature extraction. The camera and lighting system are therefore designed to consistently deliver:
- sharp kernel boundaries (better counting and sizing)
- stable color and texture representation (better defect recognition)
- reduced reflections and shadows (fewer false positives)
-
repeatable conditions (more consistent trend tracking and decision thresholds)
In other words, the camera setup is not just an accessory – it’s the measurement engine that allows SpectraAlyzer GRAIN VISION AI to produce results you can trust across shifts, sites, and seasons.
Novel Illumination Technology
Powerful Lighting
Lighting technology: controlled illumination that reveals defects
Lighting is often the difference between a “nice photo” and a reliable inspection measurement. SpectraAlyzer GRAIN VISION AI uses an engineered lighting environment to highlight kernel boundaries and make defect patterns visible—without glare or harsh shadows that confuse classification.
Key principles in the lighting setup include:
Diffuse, uniform illumination
Diffused light reduces hotspot reflections on glossy or smooth kernels and creates a more even brightness across the frame. Uniform illumination is essential for accurate segmentation (separating kernels from background) and consistent detection of discoloration, staining, and surface defects.
Shadow control
Harsh shadows can be misread as defects or distort size measurements. The system’s illumination design minimizes directional shadows so the AI measures the commodity, not the lighting artifacts.
Contrast management
A consistent background and lighting profile improves contrast between kernels and the surface below, enabling precise boundary detection. This directly improves particle counting, size distribution, and foreign material identification.
Optional illumination strategies (configuration-dependent)
Some setups may use additional lighting angles or specialized multispectral illumination modes to emphasize texture or surface structure. Where available, these options can enhance classification of specific traits (for example, differentiating subtle surface damage from normal kernel texture).
Computation
Dedictated Data Processing Hardware
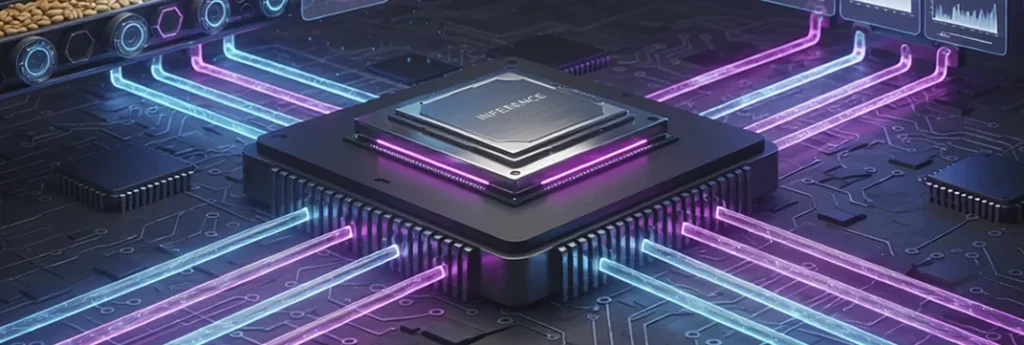
Built for AI inference, not office workloads
General-purpose PCs are optimized for email, spreadsheets, and browsing. SpectraAlyzer GRAIN VISION AI’s computing system is optimized for vision AI, which has very different requirements.
Parallel processing for image workloads
Image analysis and AI inference benefit from parallelism – processing many calculations at the same time. SpectraAlyzer GRAIN VISION AI’s computer architecture is designed to handle simultaneous tasks such as:
-
image pre-processing (noise reduction, normalization, corrections)
-
segmentation (separating kernels from background)
-
feature extraction (texture, color distributions, contours, morphology)
-
AI classification of individual kernels/objects
-
aggregation into distributions and pass/fail outcomes
-
report generation and data storage
Instead of waiting for one step to finish before starting the next, the system can pipeline these operations to keep the workflow fast and predictable.
Hardware acceleration where it matters
Vision AI models typically benefit from dedicated acceleration. The SpectraAlyzer GRAIN VISION AI platform is built to support efficient inference performance so that AI classifications happen quickly and consistently – even when analyzing dense samples with many objects or running multiple classification routines in one session.
The benefit is not just speed – it’s consistency. When compute is underpowered, systems may drop resolution, reduce analysis scope, or increase processing time unpredictably. A powerful platform keeps analysis robust and stable.
Proprietary AI algorithms

Our proprietary classification engine is designed to deliver highly accurate and consistent classification across a broad range of commodities and material categories. The system is built with generalization at its core, enabling reliable performance across different products without requiring structural redesign for each application.
A key differentiator of our technology is the fully controlled acquisition environment enabled by our instrument design. Unlike systems that depend on variable external conditions, our platform operates within a stabilized and engineered optical chamber, eliminating environmental inconsistencies and ensuring repeatable measurements.
The instrument integrates multiple tailored illumination capabilities, configurable for different application needs. By controlling wavelength distribution, illumination geometry, and intensity profiles, the system extracts optimized feature representations specific to each commodity type while maintaining a unified classification framework.
Core Capabilities:
-
High-accuracy classification across diverse commodities
-
Fully controlled optical environment for measurement stability
-
Configurable illumination modes tailored to application requirements
-
Commodity-aware feature extraction and calibration pipeline
-
Real-time and edge-ready deployment architecture
Our development approach emphasizes robustness through design, not post-processing correction. By combining controlled hardware engineering with adaptive machine learning, we deliver a scalable classification platform suitable for industrial quality control, agricultural grading, material assessment, and multi-sensor analytical systems.
Learn how it works
Analysis Workflow
Determine the Weight of the sample
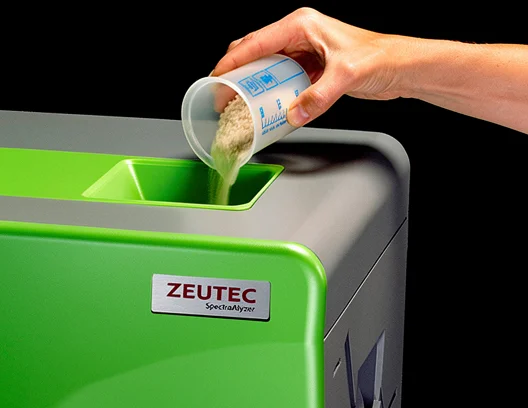
Fill the sample into the Feed Hopper.
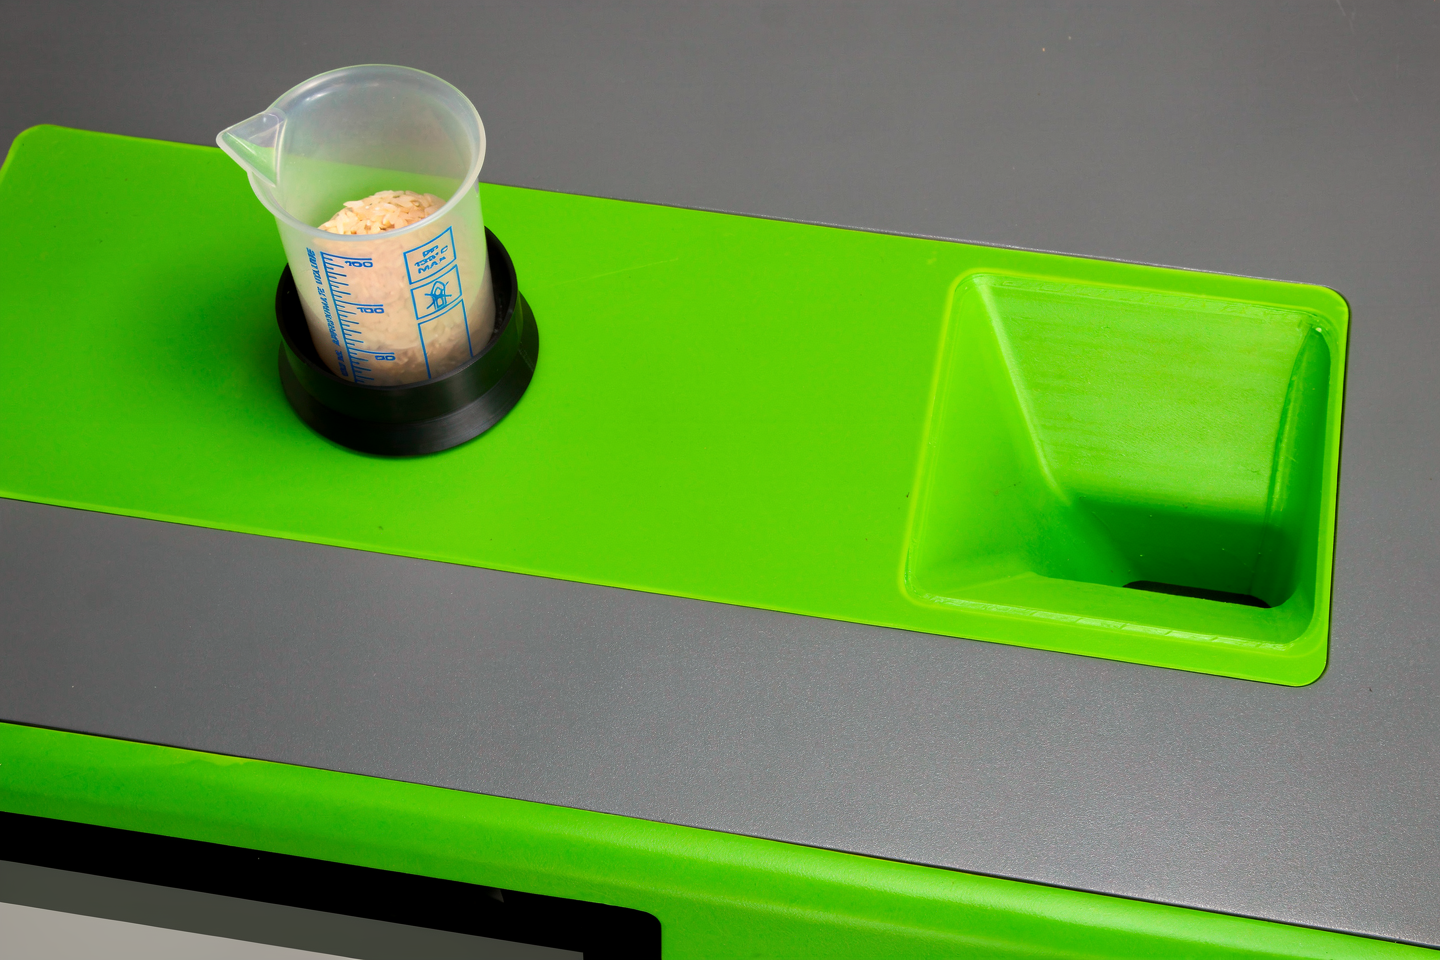
Transferring the Sample to the Measurement plane
Sample Presentation
Conveying the Sample out
Classification and Display of the Results
Analyser integration
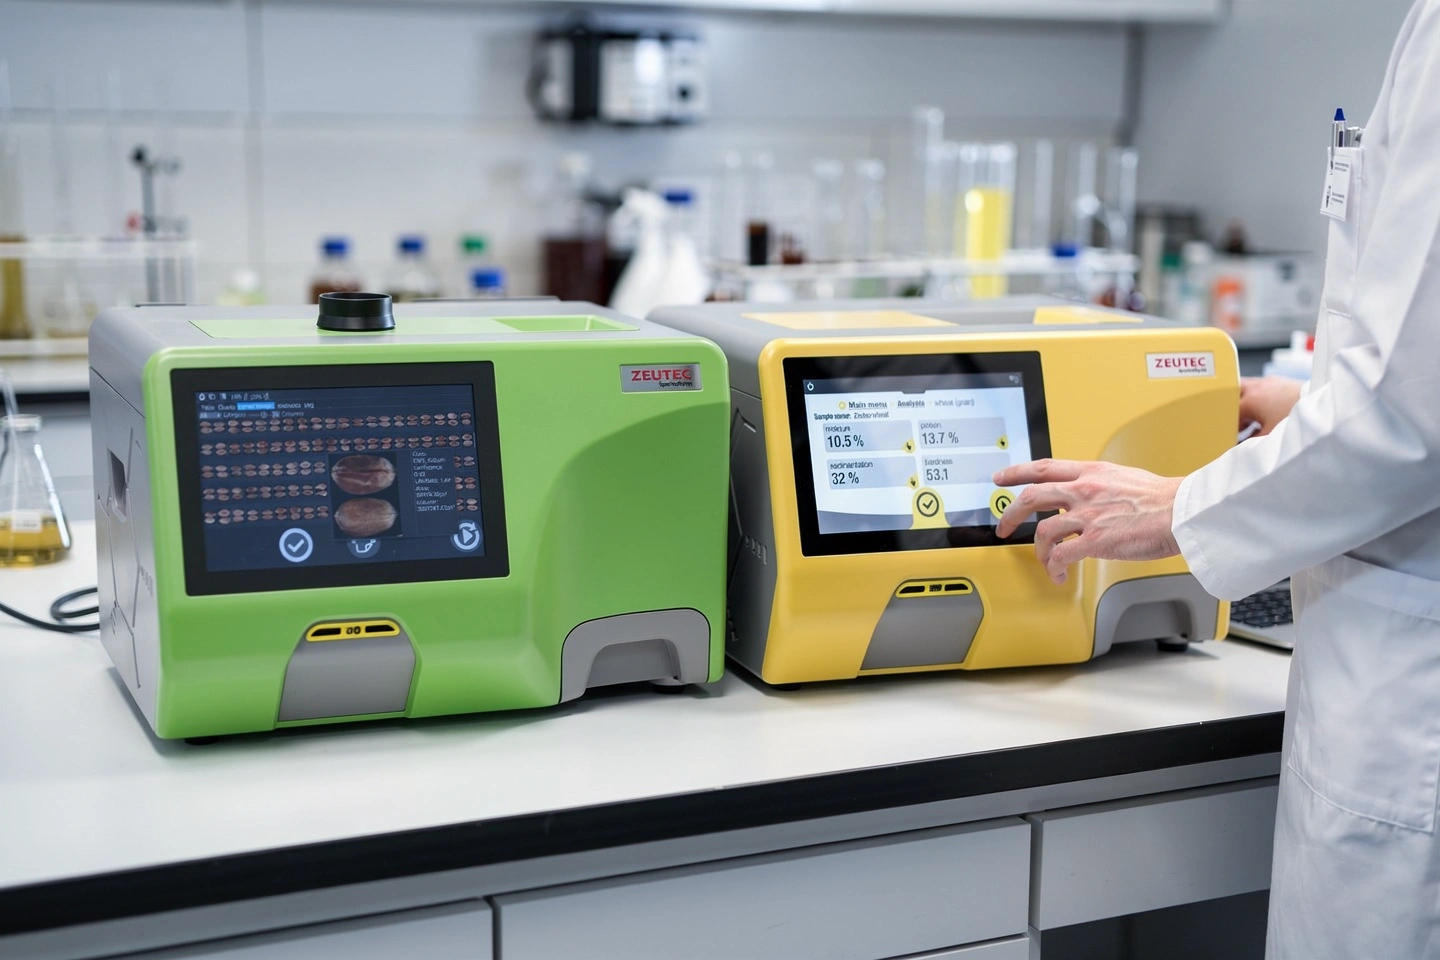
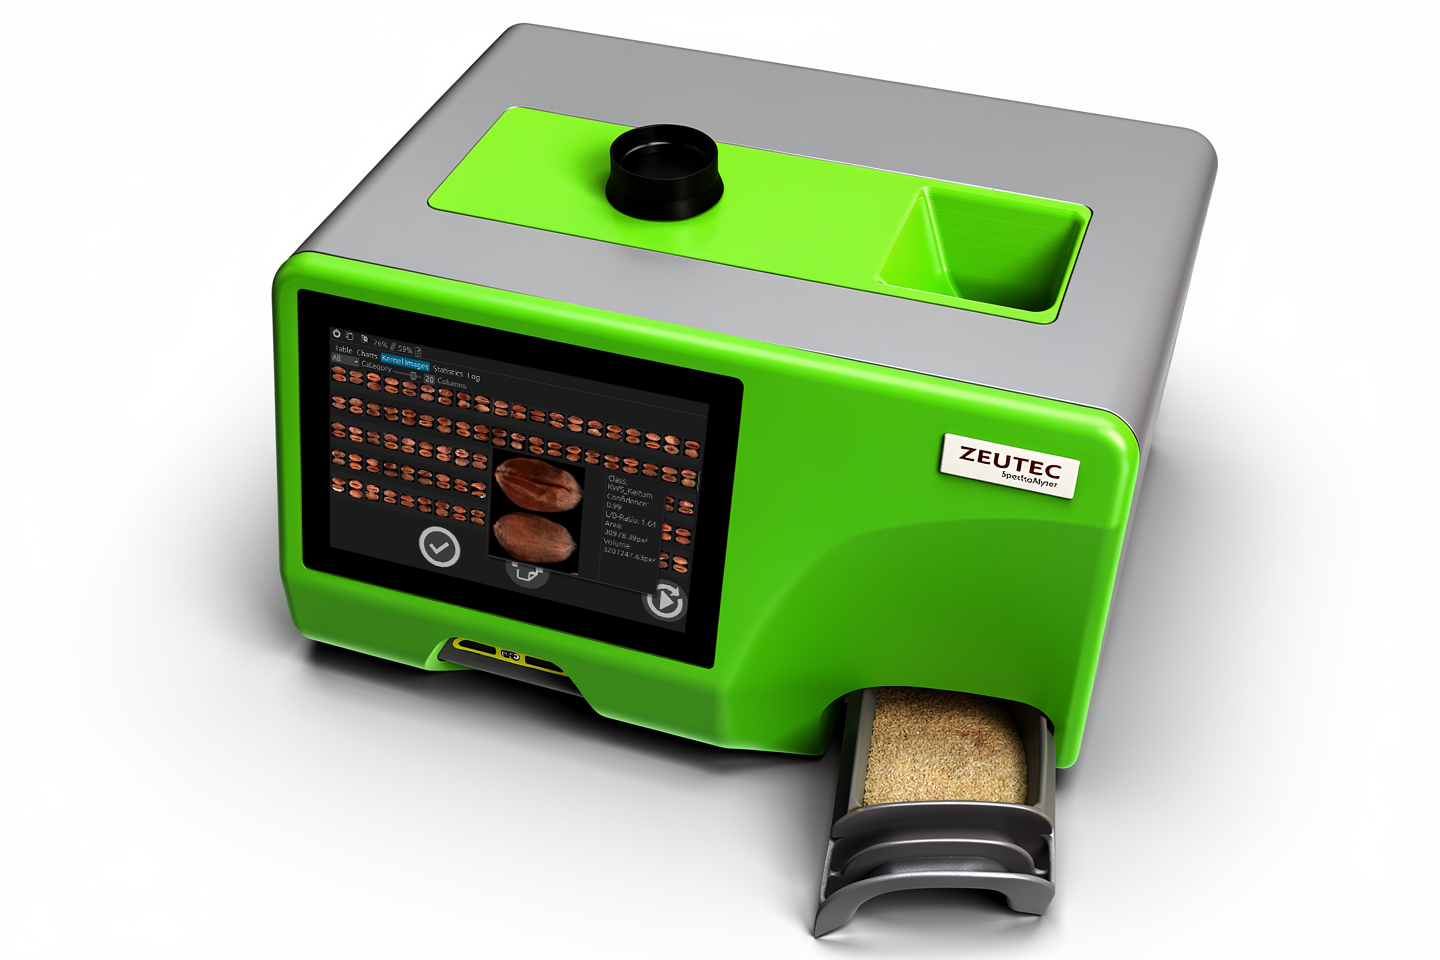
The All-In-One Morphology Analyser
The Analyser
SpectraAlyzer GRAIN VISION AI is designed as a true stand-alone analyzer - a single, self-contained instrument that turns a bulk grain sample into clear, traceable, decision-ready results without relying on external hardware, manual counting, or subjective visual grading. It combines sample handling, imaging, measurement, AI classification, and reporting in one compact workflow, so you can run consistent inspections wherever quality decisions happen: at intake, in the lab, or at critical checkpoints along the grain value chain.
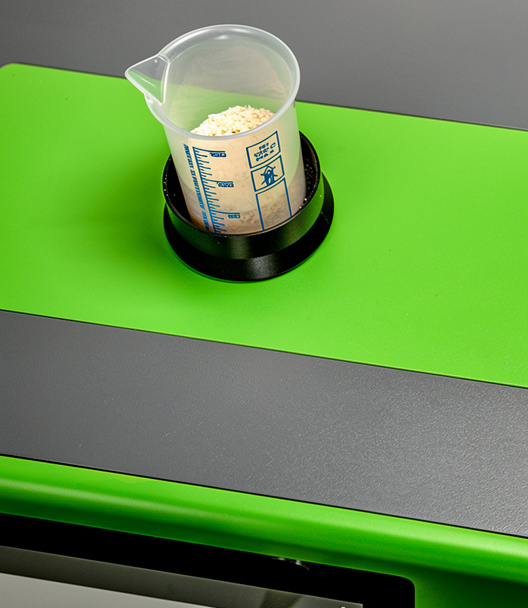
Integrated Balance
Built-in weighing for traceable, weight-based results. Every analysis begins with an integrated scale that records the sample mass. This isn’t a convenience detail; it’s what enables reliable reporting and consistent comparisons between lots, days, and sites—because the system anchors the measurement to a real, traceable sample weight from the very beginning.
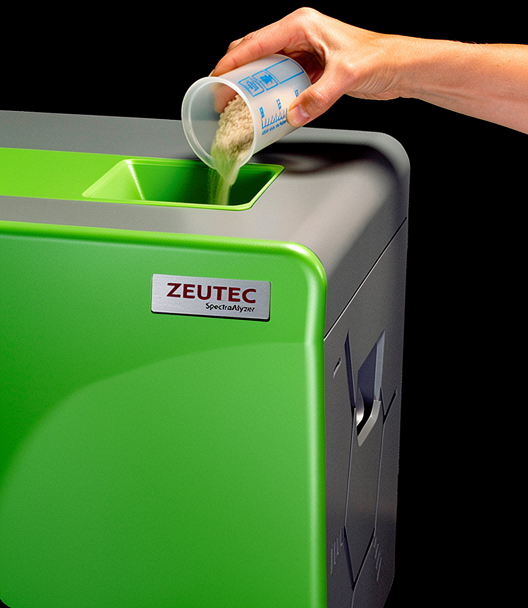
Simplified Sample Handling and Speed
Automatic, continuous sample feeding After weighing, the sample is gently and continuously fed into the observation area. This automated sample presentation removes the variability that often creeps into manual preparation (uneven spreading, inconsistent presentation, or operator differences). The instrument supports sample sizes from 1 g up to 500 g, allowing small checks or more representative batch assessments in a single cycle. Speed matters at intake and pre-shipment - yet you can’t trade speed for weak evidence. SpectraAlyzer GRAIN VISION AI is designed for high throughput, with analysis speeds exceeding 1,000 kernels per minute and fast cycle times often quoted in the 60–90 second range depending on setup and sample. At the same time, the imaging system is built for analytical depth—specified with up to ~25,000 pixels per kernel and ~20 µm resolution in published materials, supporting detailed extraction of morphology cues and defect signals.
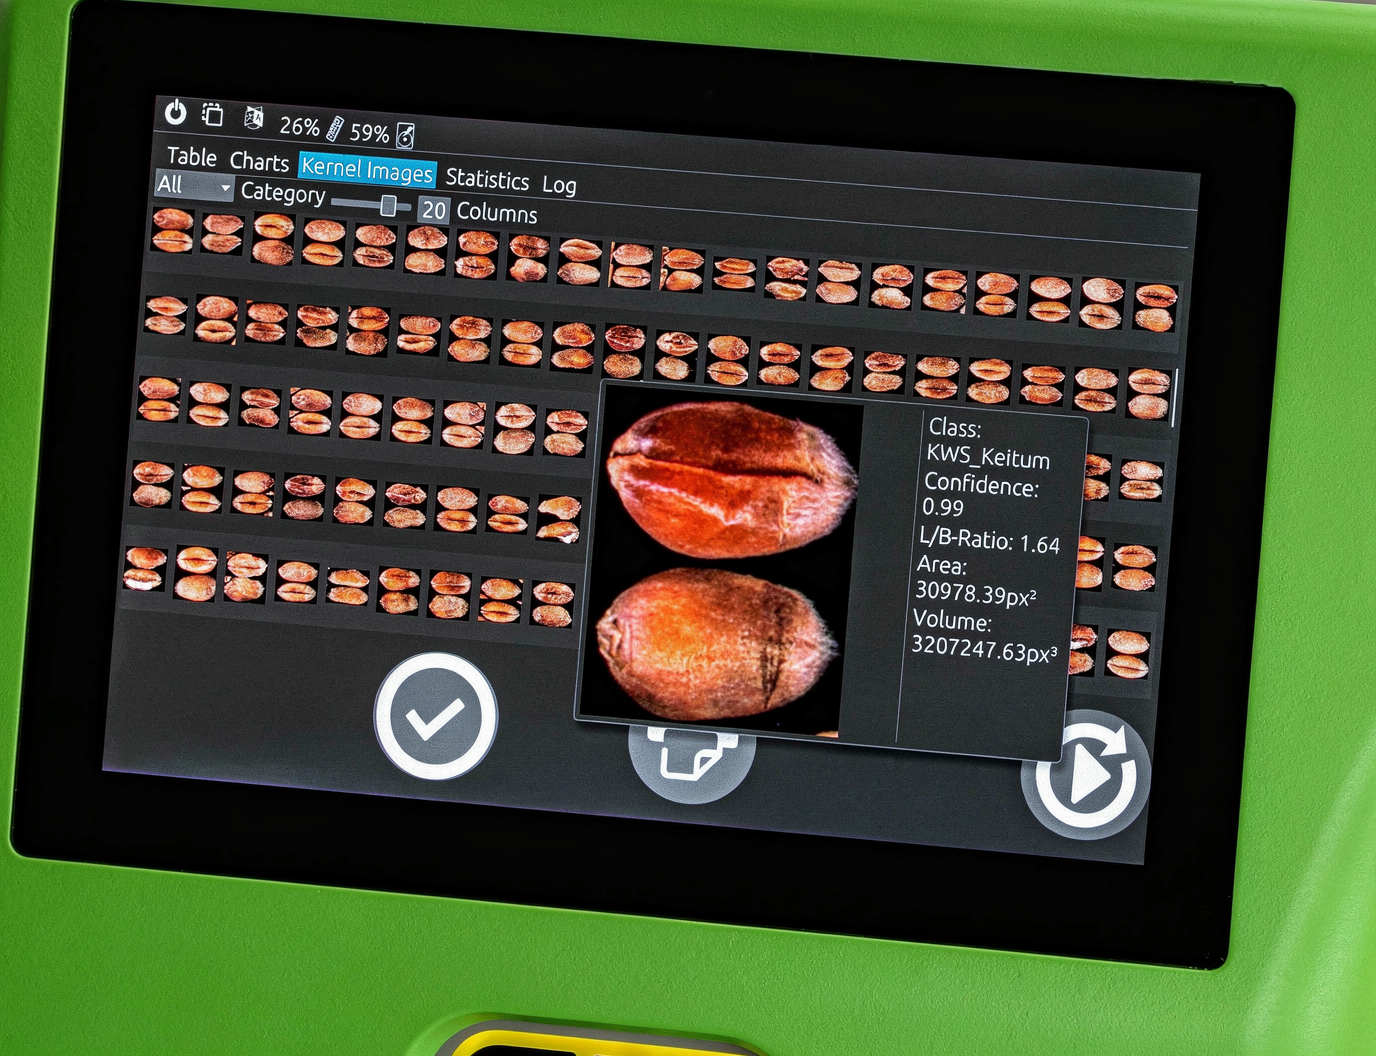
High Resolution User Interface
Onboard interface, storage, and connectivity As a stand-alone analyzer, the instrument includes a built-in touchscreen interface for operation and results review, plus structured data handling for traceability. Connectivity options such as Ethernet/USB/RS232 and web-server style access are highlighted for integrating results into broader QA workflows and enabling remote access when needed.
Precision technology for confident decisions
One Instrument Many Applications
The SpectraAlyzer VISION AI isn’t just a camera and a label—it’s a scalable classification system designed for operational reality. In markets where the difference between premium and discount can be a few percentage points, special classifications become a competitive advantage. With the SpectraAlyzer VISION AI, special applications, e.g. coffee bean grading becomes more consistent, barley routing becomes more reliable, durum translucency grading becomes more objective, and legume defect profiling becomes more actionable - so you can move faster, trade with confidence, and protect quality from origin to destination.
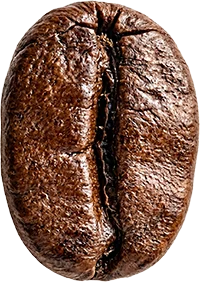

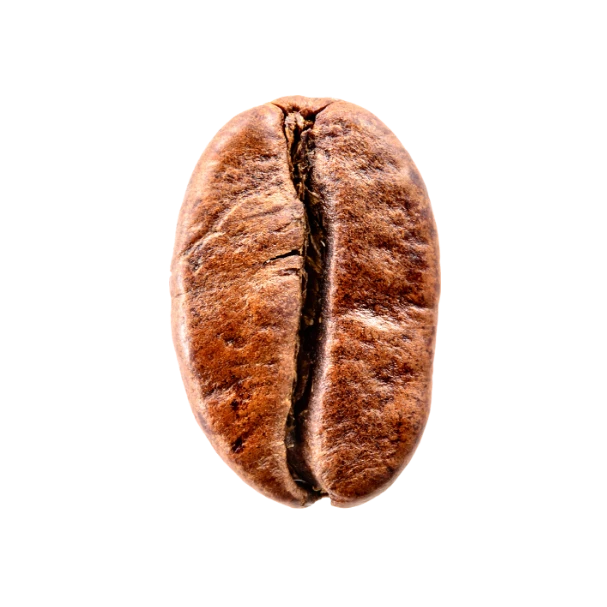
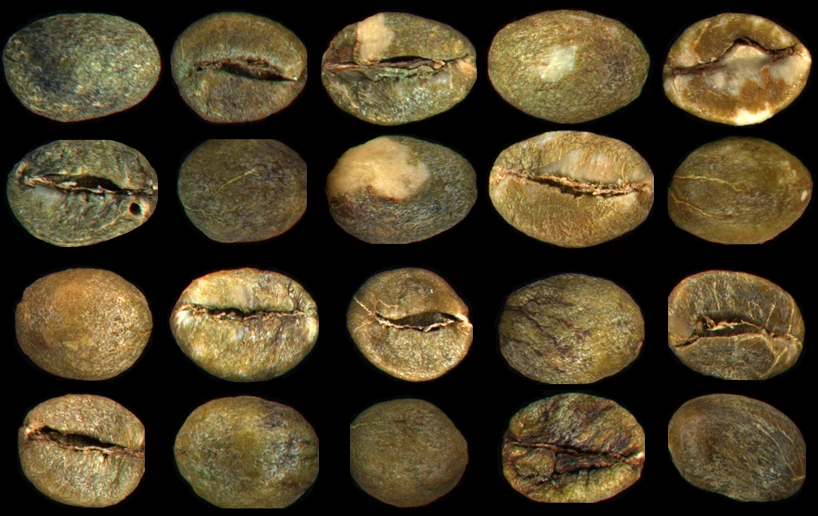
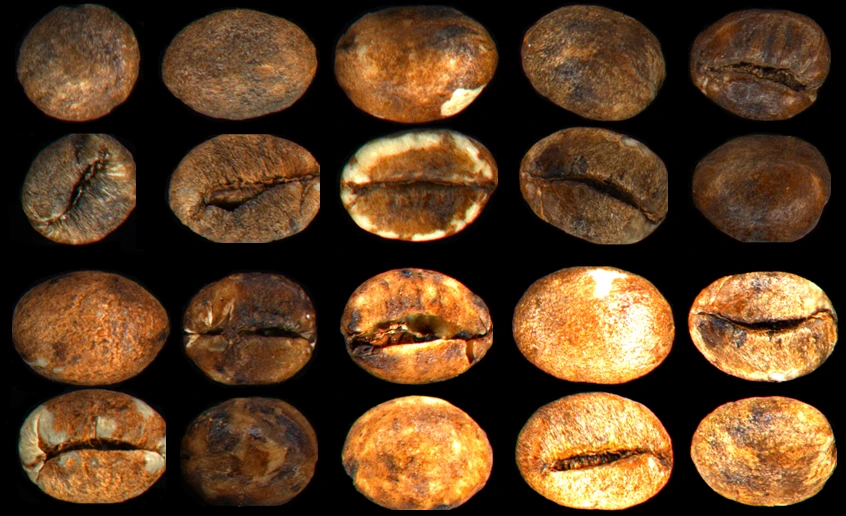
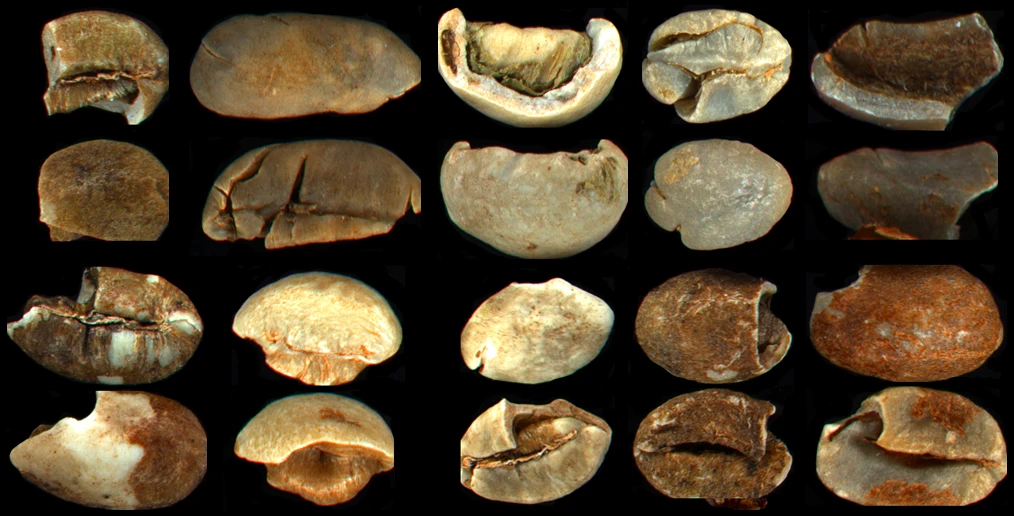
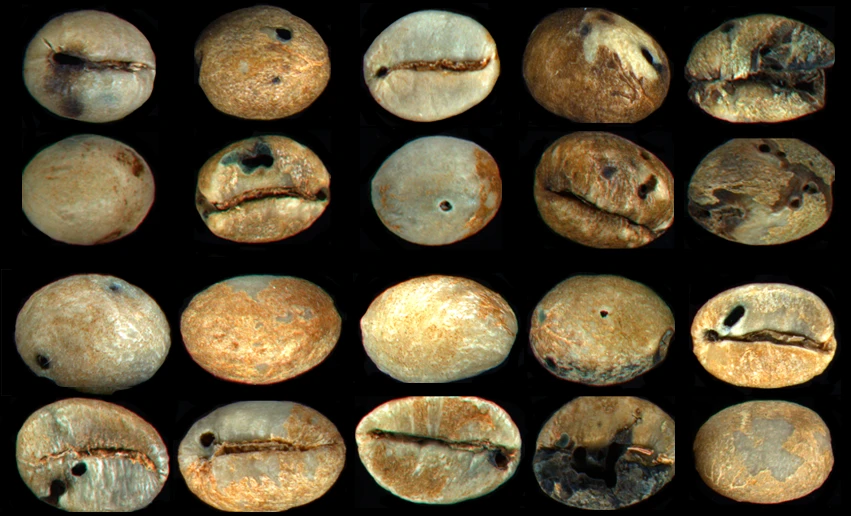
Coffee
Coffee is one of the most quality-sensitive agricultural commodities—small defect rates can change cup outcome, contract terms, and brand reputation.
SpectraALyzer VISION AI supports coffee-focused classifications by identifying and quantifying bean-level characteristics at scale:
- Bean size and uniformity: classification by size fractions and consistency, helping you validate screen-related targets and reduce uneven roasting risk.
- Color and appearance consistency: detection of abnormal coloration patterns that may indicate processing, drying, or storage issues.
- Defect recognition and distribution: systematic identification of visually detectable defects and the share of each defect type within the lot—so you understand whether issues are isolated, trending, or systematic.
- Foreign material and fragments: quantifying non-coffee particles or broken pieces that can affect customer acceptance and downstream equipment.
Benefits for coffee operations
- Faster lot decisions: release, rework, blend, or hold—based on objective defect and uniformity data.
- More consistent quality across origins and suppliers: same classification logic applied every time, reducing the “inspector-to-inspector” variability that causes disputes.
- Better roaster performance outcomes: uniformity and defect distribution insights help align green coffee prep to roasting consistency and reduce waste.
- Stronger documentation: export-ready reports and traceability that support negotiations and claims with evidence, not opinions.
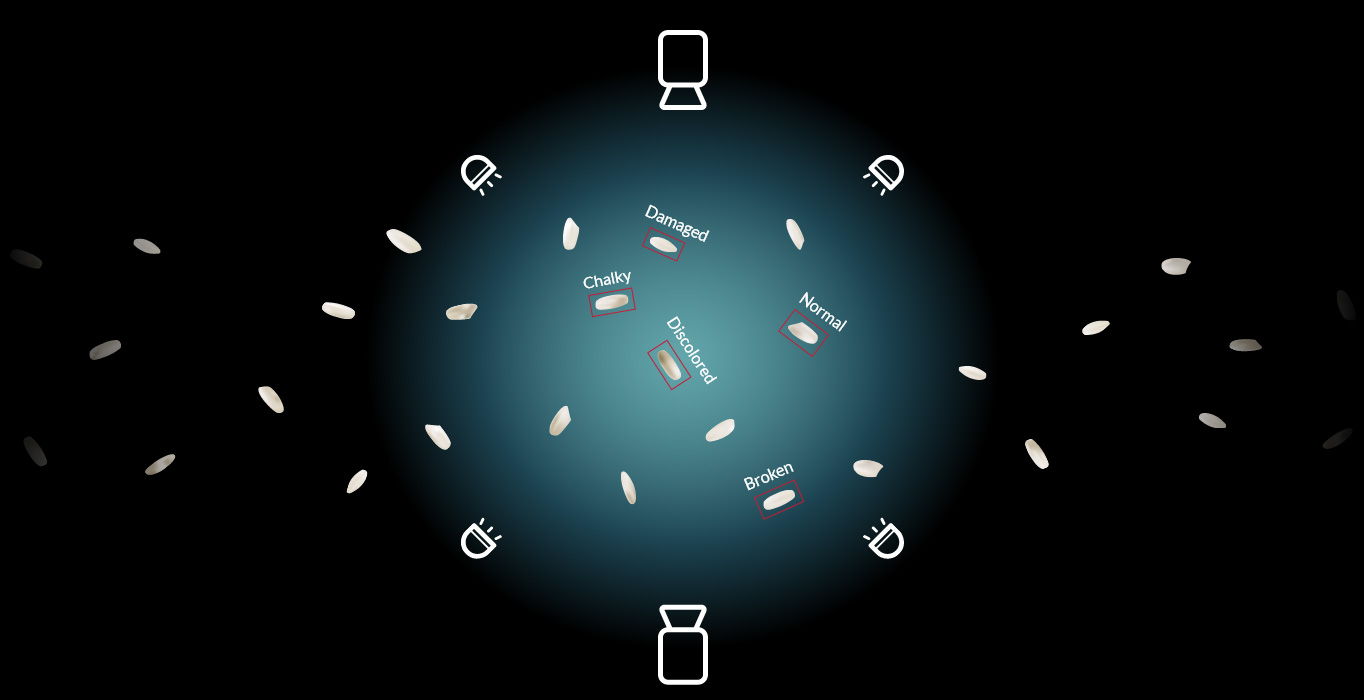
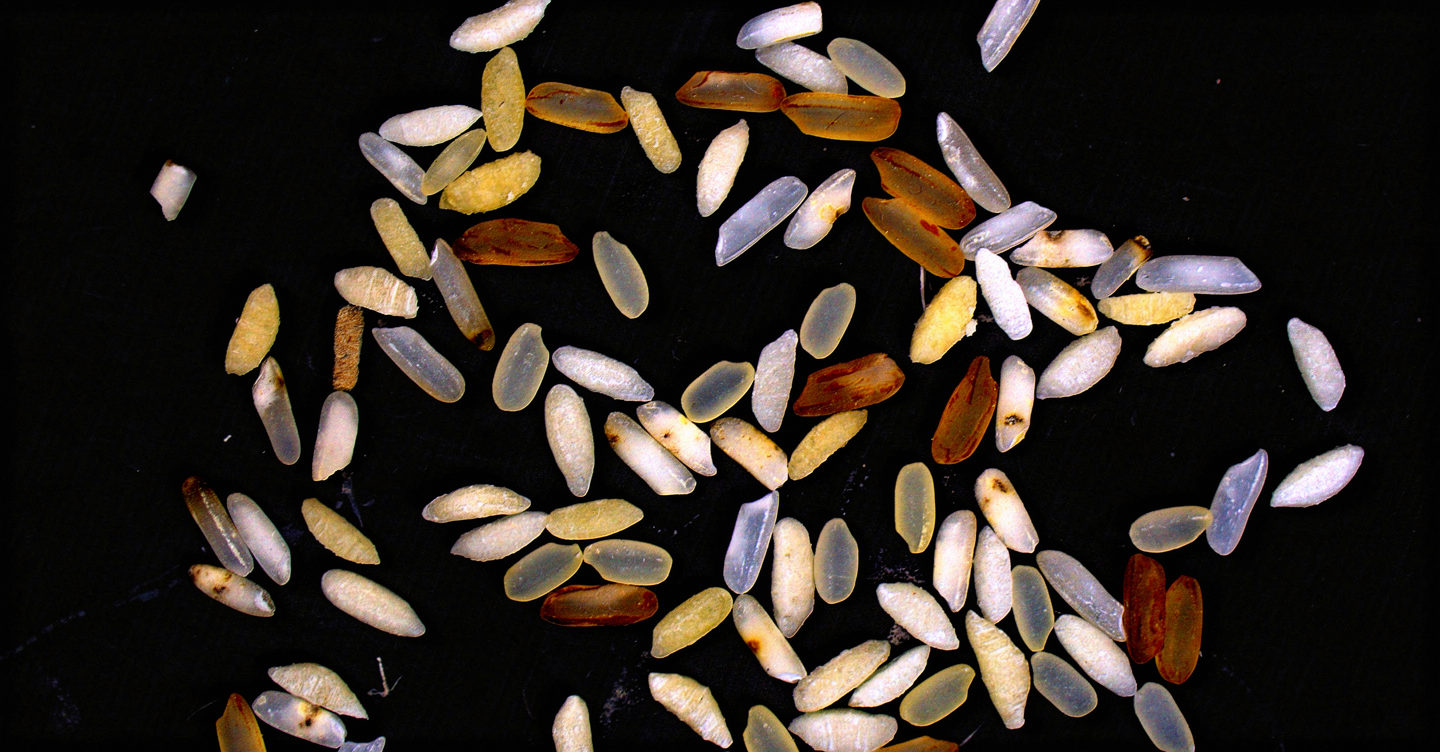
Rice
Rice quality is judged in the details: a few percentage points of broken kernels, chalkiness, discoloration, red grains, or pinpoint defects can change grade, price, customer acceptance, and processing yield.
SpectraAlyzer GRAIN VISION AI brings consistency and speed to rice inspection by using AI-driven visual analysis to classify kernels and report defect percentages and distributions—so producers and traders can make decisions based on measurable evidence, not subjective sorting.
What rice defect classification means in practice
Traditional rice grading depends heavily on manual inspection and sampling discipline. Industry standards typically define multiple quality factors and require consistent, representative evaluation to support certification and trade. SpectraAlyzer supports this need by evaluating kernels individually and summarizing results in clear categories that align with commercial language.
Typical rice-relevant classifications supported in SpectraAlyzer’s GRAIN VISION AI materials include:
- Breakage / broken kernels (and the overall broken fraction)
- Chalkiness (a key appearance and value factor)
- Damage and discoloration
- Pinpoint defects / spotted kernels
- Red grains (and related off-type appearance categories depending on spec)
- Foreign material and fragments (critical for cleaning, compliance, and customer requirements)
Just as important as the total defect percentage is the distribution—which defects dominate, whether they are rare but severe, and whether a lot looks uniform or mixed. That distribution view helps teams decide whether to accept, rework, blend, segregate, or hold a lot.
Why these defects matter commercially
Some “visual” rice traits have direct economic impact:
Chalkiness is widely recognized as a major quality issue because it reduces market value and can be influenced by agronomic and environmental stress.
Broken rice percentage is frequently priced and negotiated explicitly; consumer and market behavior can reflect sensitivity to broken levels, reinforcing why accurate quantification matters.
When results vary between inspectors or sites, disputes become costly—especially for export shipments or contract enforcement. A consistent, instrument-based approach reduces that friction.
Benefits for rice producers
1) Faster, more confident grading at intake and after milling
Producers can verify quality early—before lots are blended or committed. Rapid defect classification helps decide whether a batch should be routed to premium channels, cleaned, re-milled, or separated.
2) Better process control and yield protection
Defect breakdowns help pinpoint what to fix. For example, higher breakage can suggest handling or milling adjustments; discoloration trends can indicate drying or storage issues. Having reliable defect percentages makes it easier to tune processes and reduce rework.
3) Stronger supplier and farmer feedback loops
When quality is measured consistently, feedback becomes actionable. Producers can show partners exactly what changed (e.g., chalkiness up, discoloration down) and target improvements that protect price.
4) Documentation that supports certification and audits
Rice inspection systems and trade frequently require traceability and consistency. Standardized reports support internal QA discipline and simplify documentation workflows.
Benefits for rice traders
1) Fewer disputes and stronger negotiation leverage
With objective classification and repeatable metrics, traders can negotiate on evidence—reducing re-grades, claims, and disagreements between origin and destination results.
2) Smarter blending and segregation
Distribution-level insight is powerful for traders managing multiple origins and quality bands. Instead of blending “by guess,” traders can blend to hit contract targets (like broken percentage thresholds) while maintaining uniform appearance and defect tolerances.
3) Reduced risk in storage and logistics
Defect profiles can act as early indicators of risk (e.g., lots with higher damage/discoloration may require closer monitoring). Faster screening supports better routing decisions before shipments move.
4) Clearer customer communication
Buyers want predictable, documented quality. Transparent defect reporting builds trust and helps differentiate premium lots.
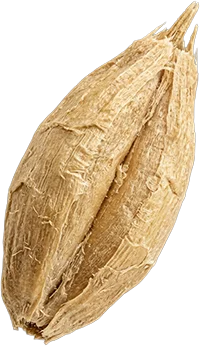
Paddy
SpectraAlyzer GRAIN VISION AI inspects rough rice (paddy) automatically and rapidly. In about a minute, it captures thousands of kernels, using AI to quantify broken kernels, chalky grains, discoloration, red kernels, pinpoint defects and foreign matter. The system outputs repeatable defect % values and visual charts for each defect class (not just a total), enabling objective grade and price decisions instead of subjective sorting. Non‑destructive imaging preserves the sample, and secure digital reports trace quality through your supply chain.
Benefits for Producers & Mills
- Faster, Confident Grading: Analyze >1,000 kernels/min and up to 500 g. Quickly confirm lot quality at intake before mixing or committing it.
- Protect Milling Yield: Detect chalkiness and micro‐cracks. IRRI reports each 1% drop in chalkiness yields ~1% higher head‐rice (whole‐grain) output. Knowing chalky/brittle grain % lets mills optimize drying and milling to maximize whole‐grain yield.
- Process Control: Detailed defect breakdown shows dominant issues (e.g. excess broken grains or discoloration). This guides adjustments (cleaning, handling or milling settings) to reduce rework and protect revenue.
Benefits for Traders & Exporters
- Standardized Quality Metrics: Aligns with trade specs. USDA/Codex grades specify % broken, red rice, chalky, etc. SpectraAlyzer reports match those categories, so buyers/sellers negotiate on shared data.
- Informed Blending: Use defect distributions, not just totals, to blend lots to contract targets. Rather than guessing, traders can mix shipments to hit limits (e.g. keeping broken & chalky levels in check) without diluting overall quality.
- Fewer Disputes: Objective, instrument-based results cut arguments. Every test yields digital, tamper-proof reports. This transparency helps resolve contract differences (export or domestic) faster.
Benefits for Quality Labs
- Consistent Results: AI image classification yields precise, reproducible defect percents by category (broken, chalky, etc.). ZEUTEC guarantees “absolute, accurate and reproducible results”.
- Non‑destructive & Fast: Tests leave the sample intact and deliver results in minutes, boosting lab throughput. Integrated scales and cameras measure size/shape, adding depth to simple weight-based tests.
- Digital Traceability: Every analysis is recorded with charts and tables. Data is stored and visualized via the instrument’s software or cloud/Web server. This audit trail simplifies reporting for certifications and audits.
Use Cases
SpectraAlyzer GRAIN VISION AI is used at multiple points: Intake QA (Accept/Reject): Quickly scan incoming paddy for grade-limiting defects. Lot Management (Blending/Segregation): Blend or segregate lots based on exact defect profiles. Milling Optimization: Track how pre-milling defects (e.g. high breakage or moisture) affect final head‐rice yield. With real-time defect charts, teams can tune drying, storage or milling to maximize yield.
Trust & Standards Alignment
Results are measurable and repeatable – the system reports exact percentages for each defect type (broken, chalky, etc.) with the sample intact. SpectraAlyzer’s reports can mirror commercial standards: for example, Codex and USDA rice standards explicitly define categories like whole vs. broken kernels, red rice, damaged/discolored grain and set tolerances. Digital output ensures full traceability (data can be printed or exported). ZEUTEC, the instrument’s manufacturer, emphasizes reliability and “traceable results” in line with these standards
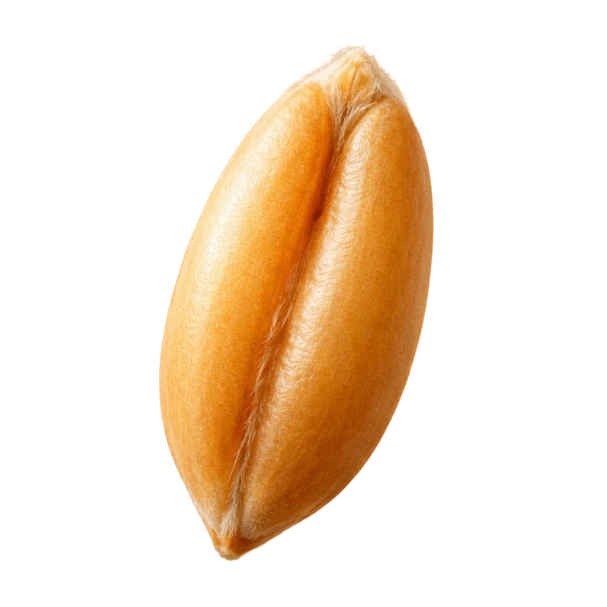
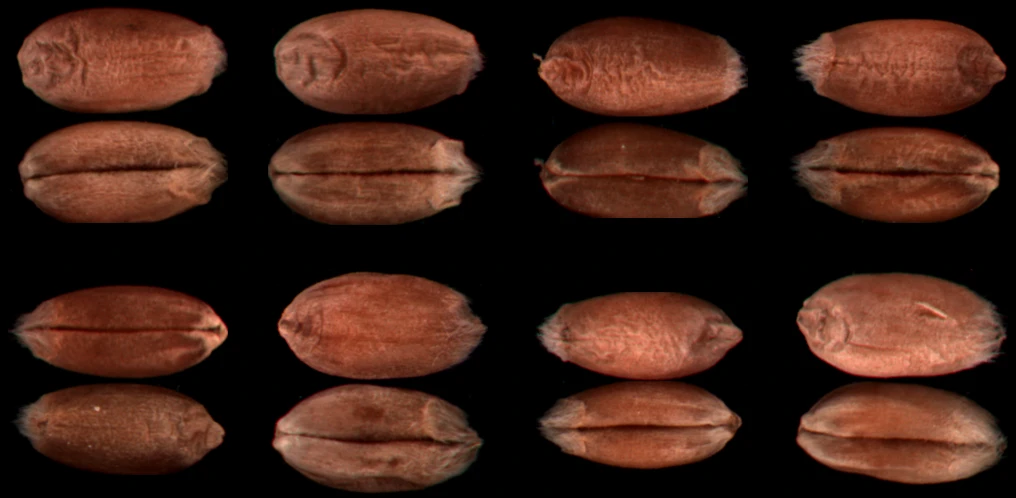
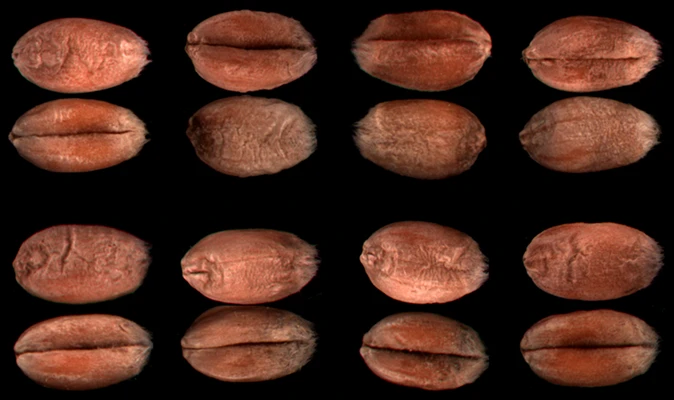
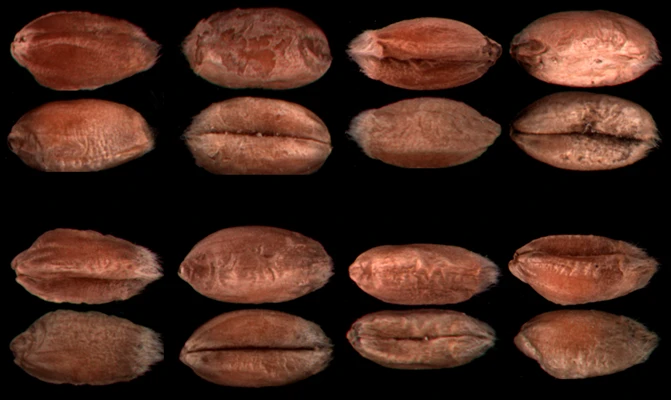
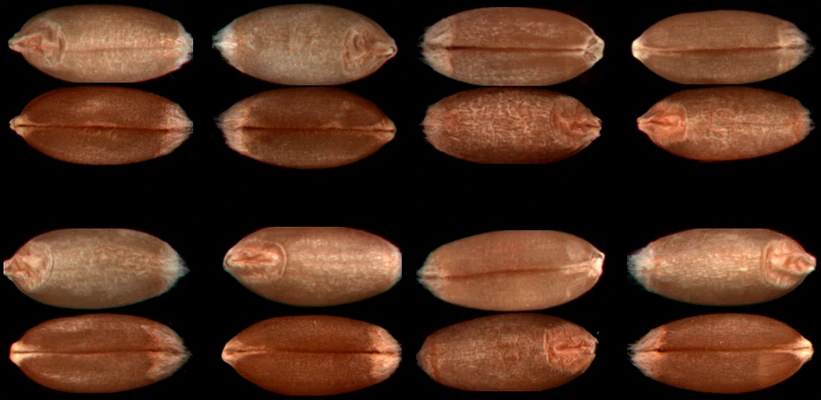
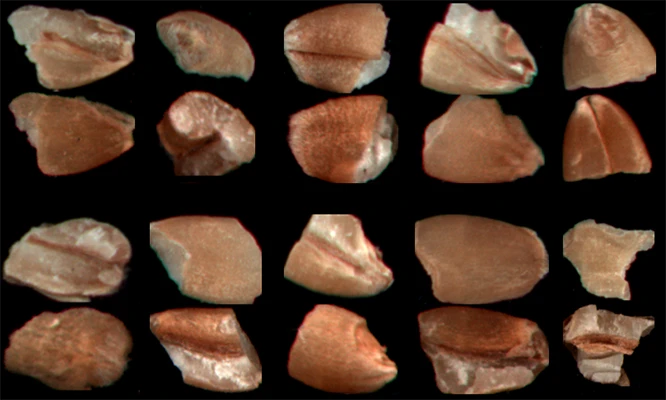
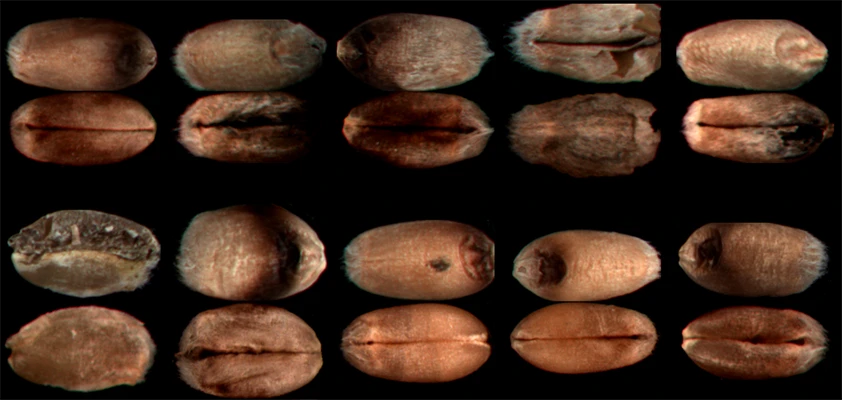
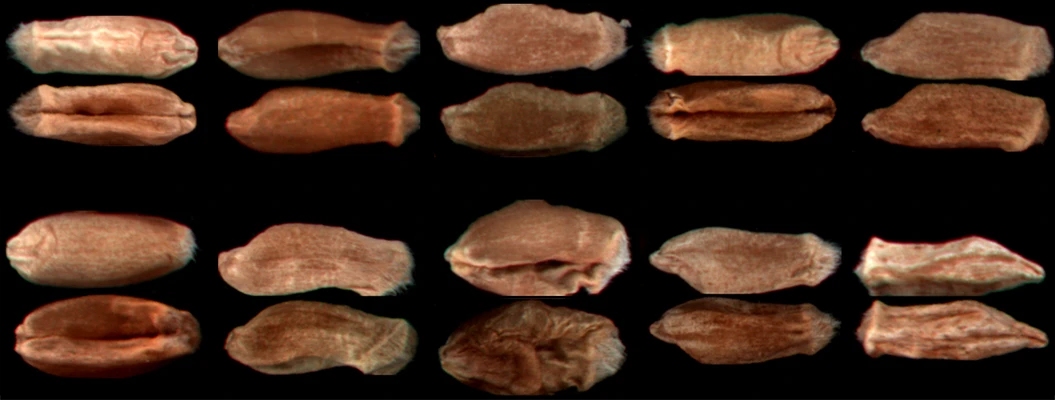
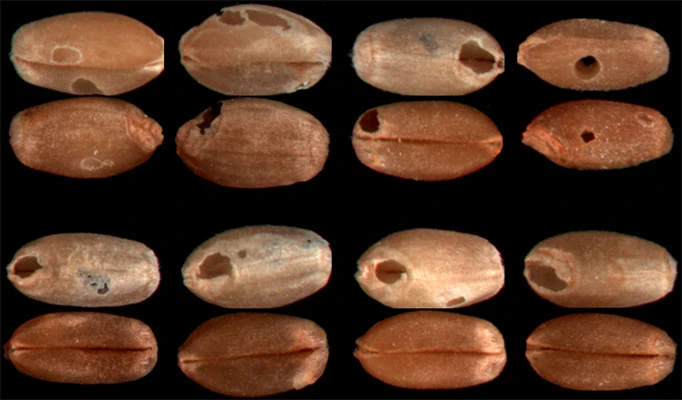
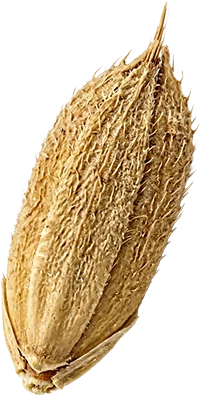
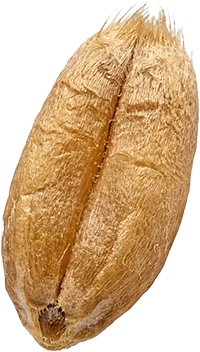
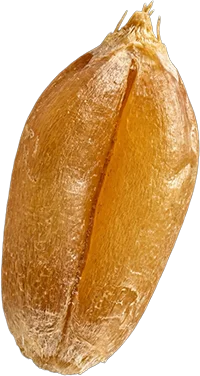
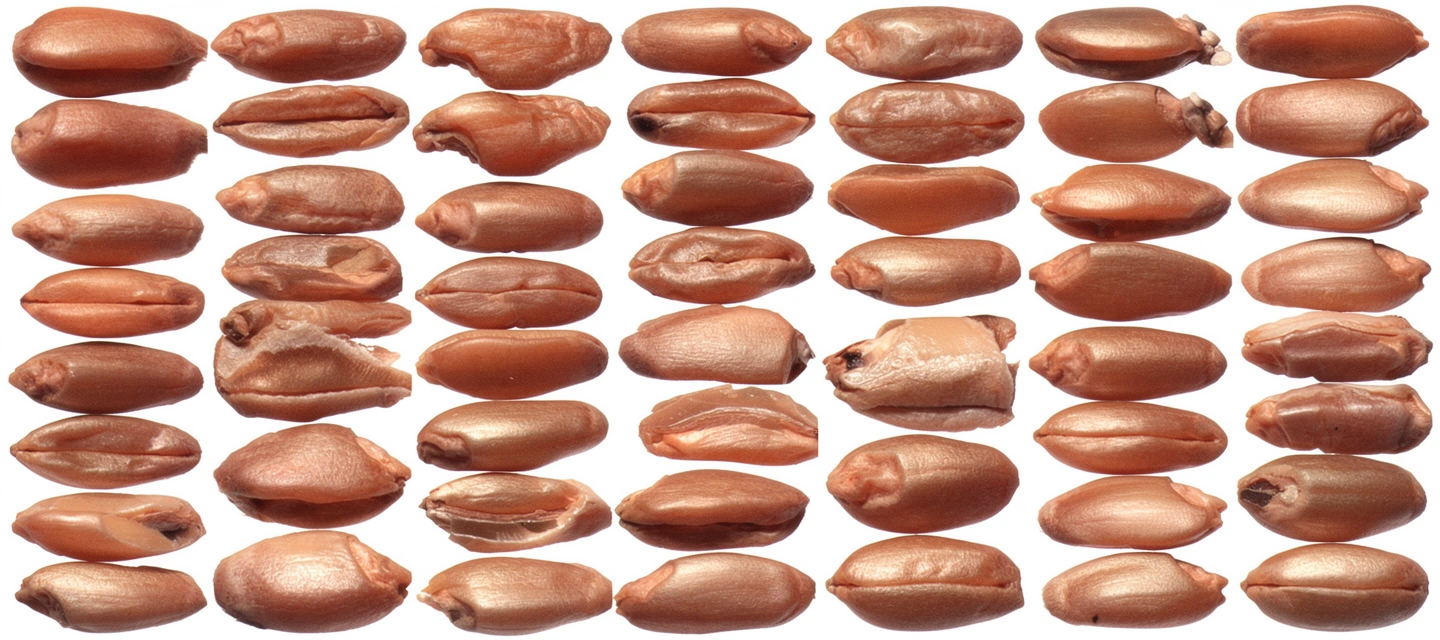
Wheat
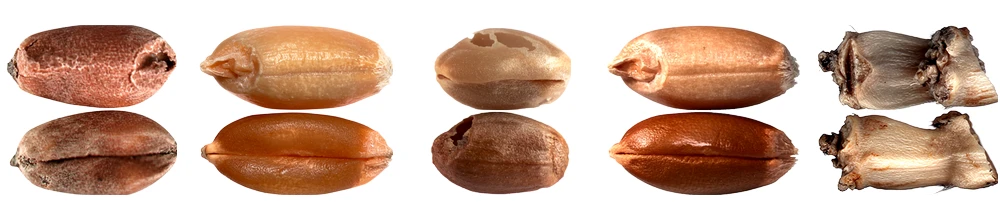
Wheat quality is priced in the small percentages. A few points of shrunken and broken kernels, damaged kernels, or foreign material can shift a lot from premium to discounted, change acceptance at destination, and create costly disputes—especially when results vary between inspectors or locations. In formal grading systems, these factors are central: U.S. wheat standards define “defects” as the combined limits for damaged kernels (total), foreign material, and shrunken and broken kernels.
SpectraAlyzer GRAIN VISION AI brings speed and consistency to wheat inspection by using AI-driven visual analysis to classify kernels and report defect percentages and distributions—so producers and traders can make decisions based on measurable evidence rather than subjective sorting. Its platform is designed for morphology analysis and AI classification of granular materials, with reporting of key physical parameters such as breakage, damage, and discolouration (among others, depending on configuration).
What wheat defect classification means in practice
Traditional wheat grading and risk assessment rely on careful sampling and trained visual evaluation—yet results can drift with lighting, fatigue, and interpretation differences. SpectraAlyzer supports wheat-focused classification by evaluating kernels individually and summarizing outcomes into clear, lot-level metrics and distributions.
Typical wheat-relevant defect categories and indicators include:
- Shrunken and broken kernels / breakage fraction (critical for grade limits and milling yield implications)
- Damaged kernels (including heat damage as part of total damage in grading frameworks)
- Foreign material (non-wheat material and impurities affecting cleanliness, handling, and contract compliance)
- Discoloration and appearance-related anomalies that can signal quality issues and drive customer perception
Beyond the totals, distribution matters: whether damage is scattered or concentrated, whether breakage is dominated by fines or larger fragments, and whether a lot is uniform or mixed. Distribution-level insight helps you decide whether to accept, clean, blend, segregate, condition, or hold—and it strengthens the evidence behind those decisions.
Why these defects matter commercially
Wheat isn’t only traded on “looks”; it’s traded on performance and risk. Research and industry guidance consistently link kernel damage and physical defects to downstream impacts such as reduced yield, reduced quality, and increased vulnerability during storage. For example, literature on wheat quality traceability notes that damage can make grain more vulnerable to insect and fungal infestation and degrade trade price.
For durum in particular, publications also describe how fusarium damaged kernels can adversely affect semolina yield and quality traits.
The practical takeaway is simple: accurate, repeatable defect measurement helps you protect value—because it reduces the chance that hidden physical quality issues become expensive downstream surprises.
Benefits for wheat producers
Faster grading at intake and after cleaning or conditioning
Producers can verify defect levels and cleanliness earlier—before lots are blended, stored long-term, or committed to customers. Rapid, instrument-based classification supports faster routing decisions and reduces re-handling.
Better process control and yield protection
When defect categories are measured consistently, process adjustments become more targeted. Rising breakage can point to handling stress; shifts in damage and discoloration can indicate drying or storage issues. With clearer data, you can tune cleaning and handling steps to reduce losses and stabilize outgoing quality.
Stronger supplier and farmer feedback
Objective defect breakdowns make quality improvement actionable. Instead of “quality was worse,” you can show what changed (e.g., more shrunken/broken, higher damage) and align corrective actions across harvesting, transport, drying, and storage practices.
Improved documentation and audit readiness
Because grading factors like damaged kernels, foreign material, and shrunken/broken are core to formal standards, consistent records help support internal QA discipline and external reporting.
Benefits for wheat traders
Fewer disputes between origin and destination
One of the costliest pain points in wheat trading is re-grading—when results differ across parties. Standardized, instrument-based classification reduces inspector-to-inspector variation and strengthens confidence in certificates and claims.
Smarter blending and segregation
Distribution insight is a blending advantage. Instead of blending “by averages,” traders can blend to meet defect limits while maintaining physical uniformity—helping protect premiums and avoid over-correction (and margin giveaway).
Reduced storage and logistics risk
Defect profiles can act as early warnings. Lots with higher damage or unfavorable distributions may require closer monitoring, shorter storage windows, or different routing—reducing the chance of deterioration-related claims.
Clearer customer communication
Buyers want predictable, documented quality. Providing transparent defect metrics supports stronger relationships and smoother negotiations—especially when contract limits are tight.
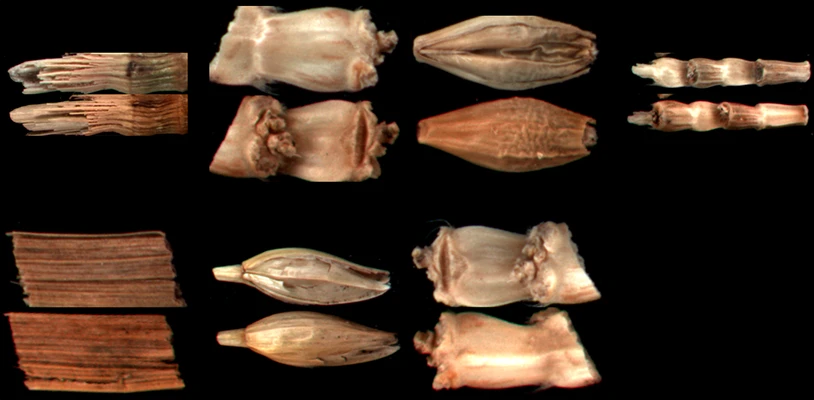
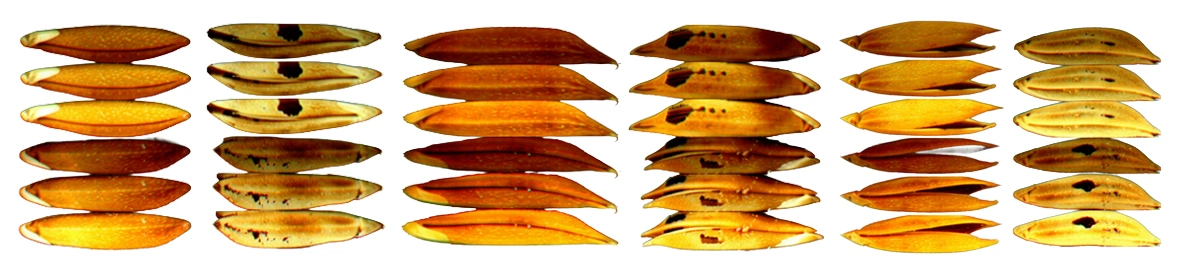
Barley
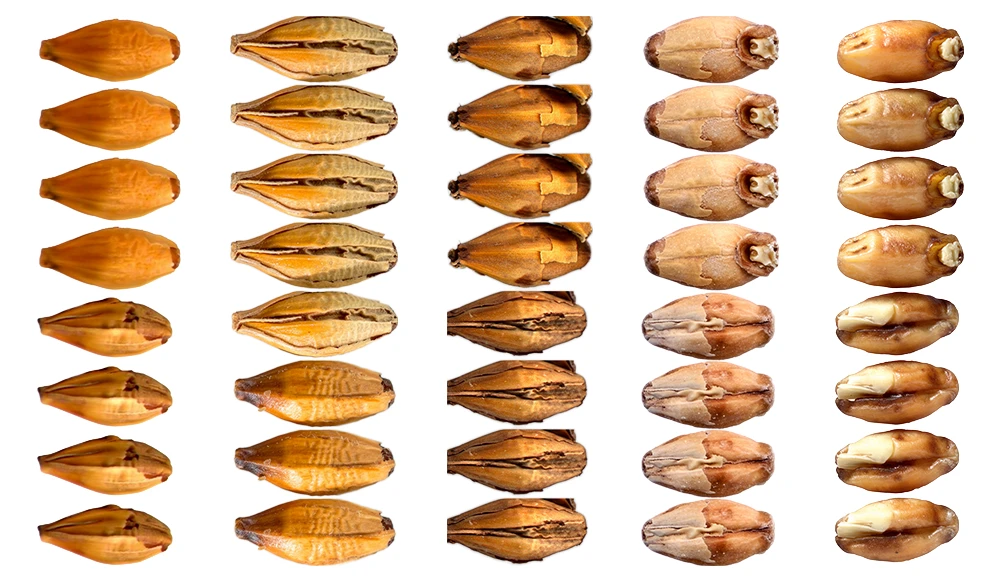
Barley: smarter grading for feed and malting pathways
Barley value can swing dramatically depending on whether it meets malting requirements or must be routed to feed. Many of the most important indicators are visible: varietey, kernel size distribution, broken kernels, sprout-related changes, skinned kernels, and general uniformity. SpectraALyzer VISION AI supports barley classification by turning these visual indicators into standardized metrics:
- Kernel size distribution (plumpness vs. thin): quantifies the fraction of kernels falling into desired size classes.
- Broken, chipped, and damaged kernels: identifies structural damage that can reduce processing performance and increase fines.
- Skinned or husk-related anomalies: flags issues that may influence handling and processing behavior.
- Lot uniformity profiling: measures variability across the sample, helping detect mixed quality or mixed origin scenarios.
Benefits for barley handlers and malt supply chains
Cleaner routing decisions: confidently assign lots to malting vs. feed streams earlier—reducing hold time and logistic friction.
Improved supplier management: trend analysis by origin/supplier reveals consistent patterns and supports performance-based procurement.
Reduced processing surprises: early detection of high breakage or poor uniformity prevents downstream throughput losses and off-spec output.
Repeatable grading across sites: harmonize standards between elevator, plant, and port—critical when contracts are tight.
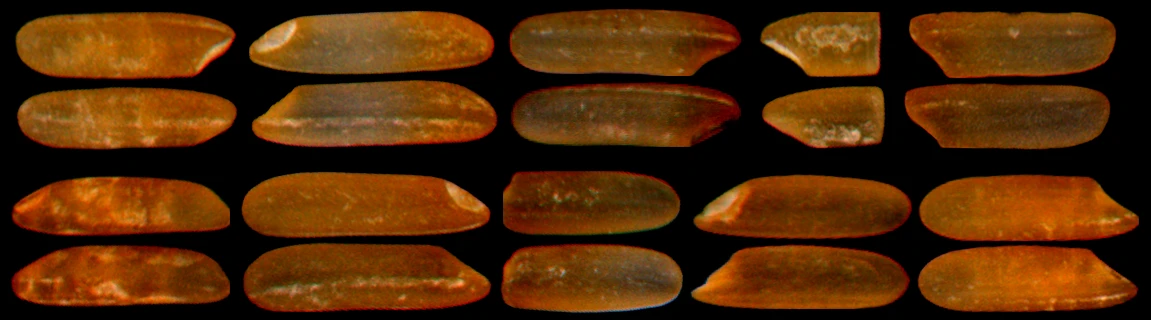
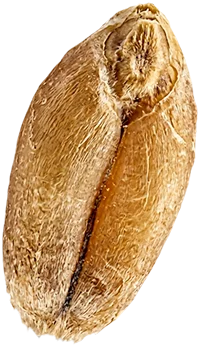
Durum wheat
Durum wheat translucency: objective vitreousness classification, at scale
Translucency (often called vitreousness) in durum wheat is a high-value classification because it correlates with milling behavior and semolina quality expectations. Yet it can be challenging to grade consistently by manual inspection—especially under varying lighting or time pressure. SpectraALyzer VISION AI enables more consistent translucency classification by evaluating kernels for optical and structural cues associated with translucent vs. starchy appearance.
Kernel-by-kernel translucency detection: classifies kernels into translucency categories and reports the share of each class.
Distribution analysis: reveals whether a lot is broadly consistent or contains clusters of low-translucency kernels that may affect performance.
Evidence-based thresholds: align translucency classification with your internal specification or customer contract requirements.
Benefits for durum wheat trading and processing
More reliable contract compliance: objective translucency distribution reduces disputes and improves certificate credibility.
Better blending control: distribution outputs make blending smarter—target the exact profile you need rather than over-correcting.
Improved process predictability: by knowing translucency mix early, mills can anticipate behavior and manage variability.
Higher confidence at origin and destination: the same rules applied at intake and at export reduce “surprise re-grades.”
Legumes
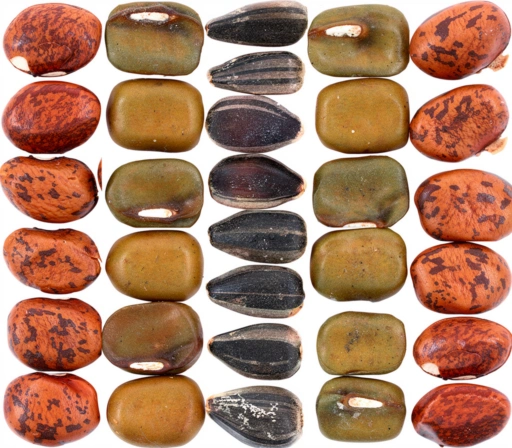
Defects in legumes: deep defect profiling for pulses and leguminous crops
Legumes (pulses) such as peas, lentils, beans, and chickpeas can present a wide range of defects that affect grade, cooking performance, appearance, and marketability. Defects may be subtle, and the commercial impact depends heavily on defect type and proportion. SpectraALyzer VISION AI supports defect determination and distribution analysis tailored to legumes—so you can measure what matters to your buyers.
Typical legume-focused defect classifications can include:
- Splits, cracks, and broken pieces: structural defects that impact appearance and processing yield.
- Discoloration and staining: identifies off-color kernels/beans that can reduce grade and consumer acceptance.
- Wrinkling, shriveling, and immature material: signals quality issues that may affect hydration/cooking performance.
- Insect-related visual damage indicators: flags potential storage/handling issues.
- Foreign matter and non-target material: quantifies impurities that drive cleaning costs and compliance risk.
Benefits for pulse processors and exporters
Fewer claims and rejections: clear defect distribution helps you meet buyer specs more consistently.
Higher sorting efficiency: by understanding which defects dominate, you can tune cleaning/sorting steps and reduce unnecessary losses.
Better inventory protection: distribution trends can act as early warning—helping you segregate, recondition, or prioritize shipment before defects escalate.
Transparent supplier conversations: defect-type breakdowns make feedback actionable, not subjective.
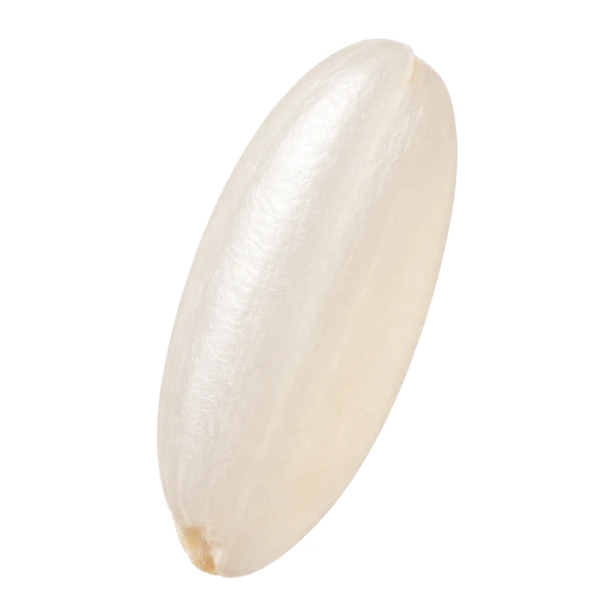
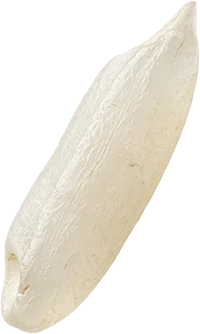
Sunflower seeds
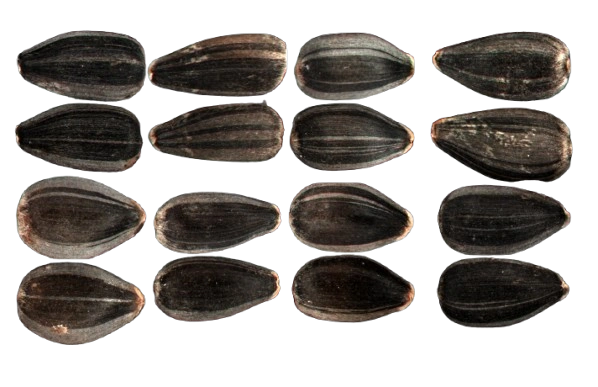
Defects in sunflower seeds: precise visual inspection for premium quality
Sunflower seeds can show defects that impact processing yield, oil content, roasting quality, and market value. SpectraALyzer VISION AI provides automated visual inspection to detect and quantify these defects, enabling processors to ensure uniform, high-quality batches and minimize losses.
Typical sunflower seed defect classifications and solutions include:
-
Broken, chipped, or split seeds: reduces oil yield and appearance; automated sorting removes damaged seeds before roasting.
-
Discoloration, black spots, or mold: indicates storage issues or disease; flagged seeds can be separated to protect batch quality.
-
Shriveled or undersized seeds: often lower in oil content; size grading ensures uniform roasting and processing efficiency.
-
Insect or pest damage: early detection prevents infestation spread; contaminated seeds can be removed automatically.
-
Foreign material (stones, shells, or debris): AI-assisted separation reduces cleaning costs and ensures compliance with buyer specs.
Benefits for sunflower seed processors and exporters:
-
Higher yield and fewer rejections: defect profiling allows only premium seeds to proceed.
-
Optimized sorting and cleaning: AI identifies dominant defect types for efficient processing.
-
Early inventory protection: detect trends such as mold or insect damage before batches degrade.
-
Transparent supplier feedback: objective defect data helps maintain quality standards across supply chains.
Right decisions begin with real knowledge.
We help you create better products, consistently.
Grain Quality Inspection and Defect Detection
Ensuring grain quality is critical for maintaining product value and meeting regulatory standards. Vision AI provides automated inspection of grain samples by identifying defects such as broken kernels, damaged grains, insect damage, and foreign matter. Using advanced computer vision and artificial intelligence, the system evaluates individual kernels quickly and consistently, eliminating the subjectivity associated with manual inspection.
By automating defect detection, laboratories, grain elevators, and processing facilities can significantly improve inspection speed and reliability. Vision AI allows operators to obtain detailed reports on grain quality within minutes, enabling better decision-making in procurement, grading, and processing operations.
Variety Identification and Commodity Classification
Correct identification of grain varieties is essential for maintaining product traceability and ensuring compliance with market specifications. Vision AI uses AI-powered image analysis to differentiate between grain varieties and commodities based on their physical characteristics such as shape, color, and texture.
This capability supports grain traders, seed producers, and laboratories by providing a fast and reliable method for commodity verification. Automated variety classification helps prevent mislabeling, supports authenticity verification, and improves transparency across the supply chain.
Automated Purity and Foreign Matter Analysis
Foreign materials and impurities can significantly impact grain quality, safety, and processing efficiency. Vision AI automatically detects and classifies foreign matter such as stones, straw fragments, husks, and other contaminants present in grain samples.
By providing detailed impurity analysis, the system enables operators to quantify contamination levels and ensure that incoming grain meets quality standards. This improves quality control processes, reduces manual sorting effort, and helps processors maintain consistent product quality.
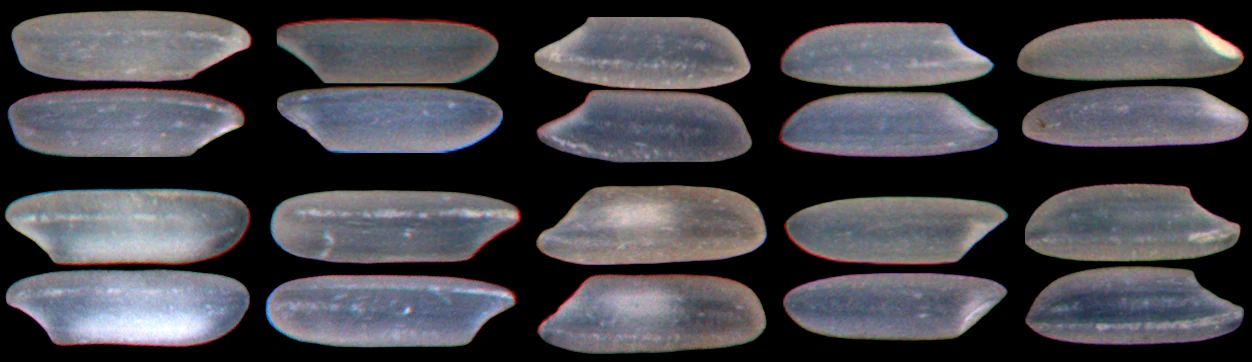
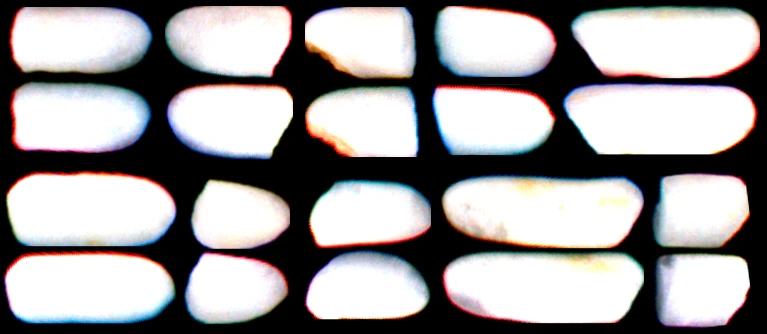
Translucency and Physical Grain Characterization
Physical grain characteristics play an important role in determining processing quality and end-product performance. Vision AI can analyze parameters such as grain size, shape, and translucency. For translucent grains like durum wheat, the system captures images using specialized illumination techniques to evaluate kernel transparency.
These measurements provide valuable insights for millers and processors who rely on physical grain properties to optimize processing conditions. Automated characterization allows laboratories to perform precise and repeatable measurements that support quality grading and product development.
AI Model Development for New Grain Applications
Every agricultural product has unique characteristics, and new analysis requirements may arise as markets evolve. Vision AI supports the development of customized AI models for analyzing new grains, seeds, or product types. Users can scan samples and build datasets that enable the creation of specialized machine learning models.
This flexibility allows organizations to expand the capabilities of their inspection system beyond standard applications. With tailored AI models, Vision AI can adapt to new commodities, regional varieties, and specific quality parameters required by customers or regulatory authorities.
Grain Quality Inspection and Defect Detection
Ensuring grain quality is critical for maintaining product value and meeting regulatory standards. Vision AI provides automated inspection of grain samples by identifying defects such as broken kernels, damaged grains, insect damage, and foreign matter. Using advanced computer vision and artificial intelligence, the system evaluates individual kernels quickly and consistently, eliminating the subjectivity associated with manual inspection.
By automating defect detection, laboratories, grain elevators, and processing facilities can significantly improve inspection speed and reliability. Vision AI allows operators to obtain detailed reports on grain quality within minutes, enabling better decision-making in procurement, grading, and processing operations.
Variety Identification and Commodity Classification
Correct identification of grain varieties is essential for maintaining product traceability and ensuring compliance with market specifications. Vision AI uses AI-powered image analysis to differentiate between grain varieties and commodities based on their physical characteristics such as shape, color, and texture.
This capability supports grain traders, seed producers, and laboratories by providing a fast and reliable method for commodity verification. Automated variety classification helps prevent mislabeling, supports authenticity verification, and improves transparency across the supply chain.
Automated Purity and Foreign Matter Analysis
Foreign materials and impurities can significantly impact grain quality, safety, and processing efficiency. Vision AI automatically detects and classifies foreign matter such as stones, straw fragments, husks, and other contaminants present in grain samples.
By providing detailed impurity analysis, the system enables operators to quantify contamination levels and ensure that incoming grain meets quality standards. This improves quality control processes, reduces manual sorting effort, and helps processors maintain consistent product quality.
Translucency and Physical Grain Characterization
Physical grain characteristics play an important role in determining processing quality and end-product performance. Vision AI can analyze parameters such as grain size, shape, and translucency. For translucent grains like durum wheat, the system captures images using specialized illumination techniques to evaluate kernel transparency.
These measurements provide valuable insights for millers and processors who rely on physical grain properties to optimize processing conditions. Automated characterization allows laboratories to perform precise and repeatable measurements that support quality grading and product development.
AI Model Development for New Grain Applications
Every agricultural product has unique characteristics, and new analysis requirements may arise as markets evolve. Vision AI supports the development of customized AI models for analyzing new grains, seeds, or product types. Users can scan samples and build datasets that enable the creation of specialized machine learning models.
This flexibility allows organizations to expand the capabilities of their inspection system beyond standard applications. With tailored AI models, Vision AI can adapt to new commodities, regional varieties, and specific quality parameters required by customers or regulatory authorities.
Technical information
| Design | AI-ML based system |
| Non-destructive assessment technique | A non-destructive measurement technique for the direct assessmen of multiple morphological parameters of grains and food bulk solids |
| 3D Imaging | 3D image of grain samples approx. 360 ° |
| Size and area calculation | Determination and calculation of grain size (LxW), area (volume/weight) |
| Integrated Scale | Integrated scale to determine sample weight |
| Measurement | Transmission |
| Sample presentation | Automatic |
| Sample feeding and analysis | automatic and uninterrupted continuous sample feeding and analysis, accommodating sample batches 1 g to 500 g |
| Measuring time | > 2 min (approx.) depending on sample batch weight |
| Screen | 12.1″, TFT 1280 x 800 pixel |
| User interface | 1000 cd/m², PCAP Glass Touch |
| Operating temperature | 5 – 40 °C, 80 % non condensing |
| Software / database storage | SD card, 128 GB, high capacity on request |
| Interfaces | 1 x front USB, 3 x back USB, 2 x RS232, 1 x Ethernet |
| Input voltage / rated current | min. 100 V AC (50 – 60 Hz), max. 240 V AC (50 – 60 Hz), 1.7 A (Provision for car adapter 12 V) |
| Protection | IP50 (dust and humidity) |
| Dimensions | Height: 393 mm / Width: 570 mm / Depth: 458 mm |
| Weight | 18 kg |
| Camera module | Two RGB 8.3-megapixel, 12-bit CMOS cameras operating at 45 fps. High-resolution cameras will capture approximately 25,000 pixels per kernel resolution, optimizing the extraction of valuable information with efficiency. |
| Optic Module | Includes Prism polarized film/lens and RGB backlight to capture better quality images with less background noise. |
| Accessories | Software package, Barcode reader, Keyboard, Printer. |
| Remote access | Remote access to data on the instrument (via PC/mobile) with the feature of a web server or cloud connection. |
Frequently asked questions
You can place an order by contacting our sales team via email (sales@zeutec.de). Once we receive your request, we will confirm availability and provide a quotation.
Order processing typically takes 1–3 business days after payment confirmation. You will receive an order confirmation once your order is successfully processed.
Yes, orders can be modified before shipment. Please contact our support team as soon as possible with your order number to request changes.
Orders can be cancelled before they are shipped. Once the order has been dispatched, cancellation may not be possible, but you may request a return depending on our return policy.
After placing your order, you will receive an order confirmation email with your order number and details.
We accept payment via:
- Bank transfer
- Approved business payment arrangements
Payment instructions will be included in the quotation or invoice.
Yes, we ship internationally. Shipping costs and delivery times depend on the destination country.
Once your order has been shipped, you will receive a tracking number and shipping details via email.
If you receive an incorrect item, please contact our support team within 48 hours of delivery with your order number and photos of the item received.
Check the package shock indicator sensor on the parcel. If the sensor shows that the package experienced improper handling during delivery, you may need to file a claim with the shipping forwarder. Otherwise, please contact us directly.
In all cases, report any damage within 48 hours of delivery. Please include photos of the package and the damaged item so we can assist you with a replacement or another suitable solution.
Yes, custom orders may be available depending on the requirements. Please contact our sales team with details of your request.
For any order-related questions, please contact our sales or customer support team and include your order number for faster assistance.
Yes. Vision AI can analyze several grains, including wheat, barley, durum, rice, and coffee, and more
Vision AI can analyze grain defects and varieties and translucency, helping to assess quality and classification.
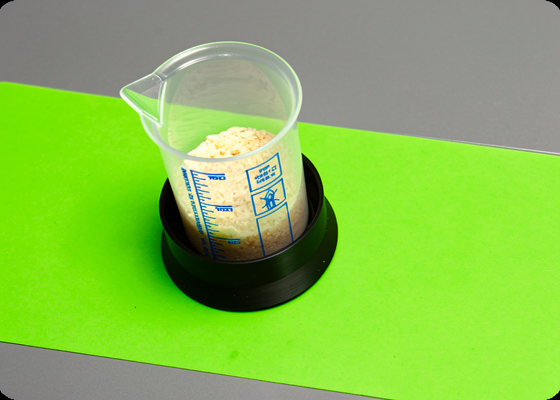
Yes, flour can be analyzed. However, sample placement must be done manually in the instrument when performing flour analysis.
For grains such as durum, translucency can be analyzed by illuminating the sample from the top and capturing the image with the bottom camera and vice versa.
Yes. New or previously uncharacterized grains can be scanned with Vision AI, and appropriate AI models can be developed to support their analysis.
Yes. Vision AI allows users to configure illumination colors and camera settings to capture images under different lighting conditions.
Yes. All images captured by Vision AI can be accessed remotely through the cloud platform, enabling remote monitoring and data access.
There is no strict limit on the amount of sample that can be fed into Vision AI. However, the total measurement time depends on the amount of sample processed.
Yes. Vision AI can detect foreign matter, broken kernels, damaged grains, admixtures, and other defects or impurities.
For each class of defect, impurity, or variety, a minimum of 3,000 individual grain kernels is recommended. For wheat, this corresponds to approximately 50 grams of sample.
Vision AI can be used for commodity identification, defect detection, purity analysis, variety classification, translucency determination, and measurement of physical characteristics such as size and shape.
Order your SpectraAlyzer Grain Vision AI
Find your local sales and service center
Get in touch
Head office
ZEUTEC GmbH
Friedrich-Voß-Str.11
24768 Rendsburg
Germany
phone: +49 4331 136650
email: moreinfo@zeutec.de
Asia Regional Office
ZEUTEC Opto-Elektronik (India) Private Limited
No. 15 & 16, First Floor, 18A Cross Dasarahalli, Dasarahalli Main Rd,
Bhuvaneswari Nagar, Hebbal Kempapura
Bengaluru, Karnataka 560024
India
phone: +91 9339994833
email: moreinfo@zeutec.de
Send us a message
We will contact you as soon as possible